Reports of Investigations
-
Books & Reports
- Reports of Investigations
- Guidebooks
- Udden Series
- Geological Circulars
- Down To Earth
- Atlases of Major Oil and Gas Reservoirs
- Texas Memorial Museum Publications
- Environmental Geologic Atlas of the Texas Coastal Zone
- Mineral Resource Circulars
- Other Reports
- Seminars and Workshops
- Handbooks
- Submerged Lands of Texas
- Symposia
- Annual Reports
- Open File Reports
- Maps & Cross Sections
- Posters
- Teachers & the Public
- Geological Society Publications
- Historic BEG & UT Series
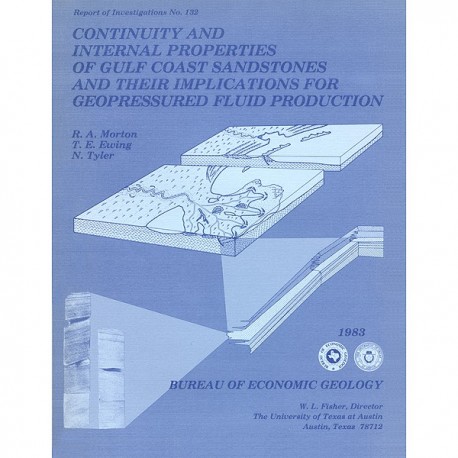
Continuity and Internal Properties of Gulf Coast Sandstones and Their Implications for Geopressured Fluid Production
RI0132
Continuity and Internal Properties of Gulf Coast Sandstones and Their Implications for Geopressured Fluid Production, by R. A. Morton, T. E. Ewing, and Noel Tyler. 70 p., 42 figs., 7 tables, 1983. ISSN: 0082335X: Print Version.
A free, digital version of this publication can be found on: Texas ScholarWorks
RI0132. Continuity and Internal Properties of Gulf Coast Sandstones and Their Implications for Geopressured Fluid Production, by R. A. Morton, T. E. Ewing, and Noel Tyler. 70 p., 42 figs., 7 tables, 1983. ISSN: 0082335X: Print.
To purchase this publication as a downloadable PDF, please order RI0132D.
ABSTRACT
Continuity of sandstone reservoirs is controlled by various factors, including faults, sand-body geometry, and the distribution of framework grains, matrices, and interstices within the sand body. Except for faults, these factors are largely inherited from the depositional environment and modified during sandstone compaction and cementation. Regional and local continuity of Gulf Coast sandstone reservoirs depends on a four-level depositional and structural hierarchy: (1) genetically related sandstones commonly associated with a single depositional system, (2) areally extensive fault blocks, (3)individual sandstones within a fault block, and (4) isolated reservoirs within a fault-bounded
Published and unpublished data on Tertiary and late Quaternary Gulf Coast sandstones of fluvial, deltaic, barrier-strandplain, and submarine channel and fan origins suggest that volumes of sand systems (first hierarchical level) are about 1011 to 1013 ft3, whereas volumes of individual sand bodies are about 109 to 1011 ft3. The continuity and productive limits of ancient sandstones are substantially reduced by faults and internal heterogeneities, which further subdivide sand bodies into individual compartments. In the Wilcox Group and Frio Formation trends of Texas, fault blocks (second hierarchical level) vary greatly in size, most being between 0.3 and 52 mi2); however, the distribution of fault blocks is strongly skewed toward small areas (<I0 mi2). Volumes of individual reservoirs (fourth hierarchical level) determined from engineering production data range from 50 percent less to 200 percent more than volumes estimated by geologic mapping. In general, mapped volumes are less than production volumes for reservoirs in which faults are nonsealing and are greater than production volumes for reservoirs in which laterally continuous shale breaks cause reductions in permeability.
Gross variations in the pore properties (porosity and permeability) of a reservoir can be predicted by examining its internal stratification and its sandstone facies if original sedimentological properties are not masked by diagenetic alterations. Six patterns are recognized that describe, in general, the vertical variations in pore properties within a sand body at a well site. Core analyses show (1) upward increases, (2) upward decreases, (3) central increases, (4) central decreases, (5) uniformly low values, and (6) irregular changes in porosity and permeability with depth. Within these trends, porosity and permeability are generally highest in large-scale crossbedded intervals and lowest in contorted, bioturbated intervals and intervals of small-scale ripple cross-laminations.
Sandstone facies models and the regional structural fabric of the Gulf Coast Basin both suggest that large and relatively continuous reservoirs should be found where barrier-strandplain and delta-front sandstones parallel regional faults. These conditions should optimize the yield and rate of fluid production from geopressured geothermal aquifers and maximize the efficiency of primary and enhanced recovery of conventional hydrocarbons. Thick fluvial-channel deposits trending roughly normal to regional faults are laterally less continuous than barrier and delta-front sandstones, but they may also be significant targets for exploration and production of unconventional and conventional energy resources.
Keywords: Texas, Gulf Coastal Plain, Tertiary, sediments, structure contour maps, stratigraphic maps, reservoir properties, sand bodies, geothermal energy
CONTENTS
ABSTRACT
INTRODUCTION
Quantification of inhomogeneities
STRUCTURAL AND STRATIGRAPHIC LIMITS OF SANDSTONE RESERVOIRS
Sand-body and reservoir hierarchy
Possible external contributions
CHARACTERISTICS AND DIMENSIONS OF GULF COAST SANDSTONES
Limitations of data
Late Quaternary sediments
Fluvial sandstones
Mississippi River
Rio Grande
Brazos River
Deltaic sandstones
Mississippi delta
Rio Grande delta
Brazos delta
Barrier and strandplain sandstones
Padre Island
Galveston Island
Grand Isle
South Padre Island
Ingleside strandplain
Shelf and slope sandstones
Tertiary sediments.
Fluvial sandstones.
Deltaic sandstones
Barrier and strandplain sandstones.
Shelf and slope sandstones
Sediments in other basins
FAULT-COMPARTMENT AREAS
COMPARISON OF PRODUCTION AND GEOLOGIC ESTIMATES OF AQUIFER FLUID VOLUME
Calculation of aquifer fluid volume from production data
South Cook field
Stratigraphy of producing sands
Structure of the South Cook area
Reservoir volume of the B sand
Reservoir volume of the C sand.
Summary
Yorktown and South Yorktown fields
Stratigraphy of the Migura sand.
Structure of the Yorktown area
Reservoir volume of Yorktown field
Reservoir volume of South Yorktown field
Summary
Christmas field
Stratigraphy of the Migura sand.
Structure of the Christmas area
Reservoir volume of Christmas field
Southeast Pettus field
Stratigraphy of the First Massive sand
Structure of the Pettus area
Reservoir volume of the First Massive sand
South Braslau field
Stratigraphy of the First Tom Lyne sand
Structure of the South Braslau area
Reservoir volume of South Braslau field
South Peach Point field
Stratigraphy of the Frio A sand
Structure of the Peach Point area
Reservoir volume of South Peach Point field
Mobil-David L field
Stratigraphy of the Anderson sand
Structure of the Mobil-David area
Reservoir volume of the Anderson sand
Comparisons and conclusions
GEOLOGIC SETTING AND RESERVOIR CHARACTERISTICS, WELLS OF OPPORTUNITY
Riddle No. 2 Saldana well
Stratigraphy of the First Hinnant sand
Reservoir volume of the First Hinnant sand
Ross (Coastal States) No. 1 Pauline Kraft well
Structure of the Mobil-David area
Reservoir volume of the Anderson sand
Lear No. 1 Koelemay well
Stratigraphy of the Leger sand
Structure of the Leger sand
Reservoir volume of the Leger sand
Conclusions, well-of-opportunity study
INTERNAL PROPERTIES OF SANDSTONES.
Porosity and permeability of modern sands
Detailed investigation of vertical changes in porosity and permeability
Variations in grain size and primary sedimentary structures
Bioturbation and texture
Induration
Porosity and permeability as a function of depositional environment
Facies control on reservoir continuity
Vertical patterns of pore properties
Pore properties and stratification
Frequency and arrangement of flow barriers
IMPLICATIONS FOR GEOPRESSURED FLUID PRODUCTION
ACKNOWLEDGMENTS
REFERENCES
APPENDIX A: Metric conversion factors
FIGURES
1. Locations of sand bodies listed in table 1
2. Stratigraphic section of late Quaternary Rio Grande deltas near South Padre Island
3. Distributions of subaerial environments and subsurface sediment types in the recently formed Brazos delta
4. Histograms of fault-compartment
5. Locations of hydrocarbon and geothermal trends, geothermal test wells, and Texas Gulf Coast areas studied in this report
6. Calculations for estimating aquifer volume
7. Net·sand map, B and C sands, South Cook field
8. Structure and net-sand map, Yorktown area
9. Stratigraphic section of lower Wilcox Group sands, Yorktown area
10. Structure sections, Yorktown area
11. Structure and net-sand map, Christmas area
12. Stratigraphic section of lower Wilcox Group sands, Christmas area
13. Structure and net-sand map, Pettus area
14. Stratigraphic section of upper Wilcox Group sands, Pettus area
15. Structure and net-sand map, Braslau area
16. Stratigraphic section of upper Wilcox Group sands, Braslau area
17. Structure and net-sand map, Peach Point area
18. Stratigraphic section of sub-Nodosaria blanpiedi sands of the Frio Formation, Peach Point area
19. Structure section, Peach Point area
20. Structure and net-sand map, Mobil-David area
21. Stratigraphic section of lower Frio Formation sands, Mobil-David area
22. Comparison of production and geologic estimates of aquifer volume
23. Structure and net-sand map, Riddle No. 2 Saldana area
24. Porosity and permeability variations and spontaneous potential of three reservoirs tested by the well of-opportunity program
25. Stratigraphic section of First Hinnant sand, Riddle No. 2 Saldana and Northeast Thompsonville areas
26. Stratigraphic section through Riddle No. 2 Saldana well of uppermost Wilcox Group sands
27. Structure section through Ross (Coastal States) No. 1 Pauline Kraft well, Mobil-David area
28. Structure and net-sand map, Lear No. 1 Koelemay area
29. Stratigraphic section of Yegua Formation sands, Lear No. 1 Koelemay area
30. Location of the General Crude Oil-Department of Energy Pleasant Bayou Nos. 1 and 2 geopressured geothermal test wells and structure at the TS marker
31. Explanation of symbols in figures 32 through 35
32. Detailed core description, pore properties, and interpretation of the upper part of the Frio T3 correlation unit
33. Detailed core description, pore properties, and interpretation of the geopressured geothermal production interval (Andrau, or C, sand)
34. Detailed core description, pore properties, and interpretation of the upper part of the Frio F correlation interval (TS unit).
35. Detailed core description, pore properties, and interpretation of the lower part of the Frio F correlation interval (TS unit)
36. Large-scale cross-stratification in permeable, porous sandstone interpreted as a bed-load distributary-channel deposit; intermediate- to small-scale crossbedded sandstone of the geopressured geothermal production interval; and ripple-laminated sandstone overlain by horizontally bedded sandstone with thin mud drapes
37. Interlaminated very fine grained sandstone and siltstone interpreted as shallow marine storm-related sequences; highly bioturbated sandstone
38. Net-sand map of the sub-TS Andrau sand (the geopressured geothermal production interval)
39. Fence diagram showing the continuity of depositional units in the geopressured geothermal production interval
40. Lobate net-sand pattern of the T3 correlation interval
41. Cross sections through the T3 correlation interval
42. Generalized patterns of vertical changes in pore properties within a sand body
TABLES
1. Approximate dimensions of late Quaternary Gulf Coast sand bodies
2. Approximate dimensions of Tertiary Gulf Coast sand bodies
3. Approximate dimensions of non-Gulf Coast sand bodies
4. Areas of fault compartments in Wilcox geopressured fairways
5. Areas of fault compartments in Frio geopressured fairways
6. Volume estimates of geopressured gas reservoirs, Texas Gulf Coast
7. Reservoir area and volume of Texas Gulf Coast wells of opportunity
Citation
Morton, R. A., Ewing, T. E., and Tyler, Noel, 1983, Continuity and Internal Properties of Gulf Coast Sandstones and Their Implications for Geopressured Fluid Production: The University of Texas at Austin, Bureau of Economic Geology, Report of Investigations No. 132, 70 p.


