Reports of Investigations
-
Books & Reports
- Reports of Investigations
- Guidebooks
- Udden Series
- Geological Circulars
- Down To Earth
- Atlases of Major Oil and Gas Reservoirs
- Texas Memorial Museum Publications
- Environmental Geologic Atlas of the Texas Coastal Zone
- Mineral Resource Circulars
- Other Reports
- Seminars and Workshops
- Handbooks
- Submerged Lands of Texas
- Symposia
- Annual Reports
- Open File Reports
-
Maps & Cross Sections
- Thematic Maps
- Miscellaneous Maps, Charts & Sections
- Geologic Atlas of Texas
- STATEMAP Project Maps
- Geologic Quadrangle Maps
- Cross Sections
- Highway Geology Map
- Energy and Mineral Resource Maps
- Shoreline Change and Other Posters
- Wilcox Group, East Texas, Geological / Hydrological Folios
- Bouguer Gravity Atlas of Texas
- River Basin Regional Studies
- Featured Maps
- Posters
- Teachers & the Public
-
Geological Society Publications
- Gulf Coast Association of Geological Societies
- Alabama Geological Society
- Austin Geological Society
- Corpus Christi Geological Society
- Houston Geological Society
- Lafayette Geological Society
- Mississippi Geological Society
- New Orleans Geological Society
- South Texas Geological Society
- GCS SEPM Publications
- Historic BEG & UT Series
Numerical Modeling of Regional Ground-Water Flow...Deep-Basin Brine Aquifer of the Palo Duro Basin... Digital Download
RI0159D
For a print version: RI0159.
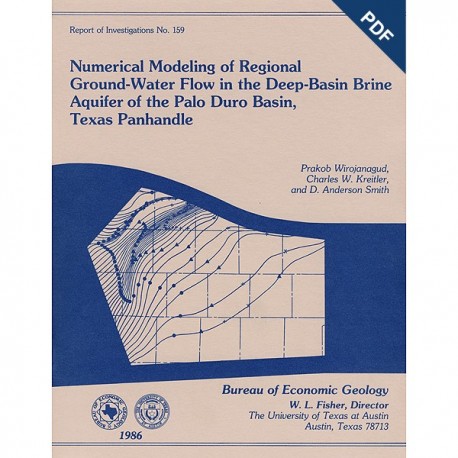
RI0159D. Numerical Modeling of Regional Ground-Water Flow in the Deep-Basin Brine Aquifer of the Palo Duro Basin Texas Panhandle, by Prakob Wirojanagud, C. W. Kreitler, and D. A. Smith. 68 p., 46 figs., 6 tables, 3 appendices, 1986. doi.org/10.23867/RI0159D. Downloadable PDF.
To purchase this publication in book format, please order RI0159.
ABSTRACT
A conceptual hydrogeologic model of the Palo Duro Basin, Texas Panhandle, subdivides the basin into three hydrogeologic units: (1) the shallow Ogallala and Dockum aquifers (Upper aquifer), (2) the Permian evaporite aquitard (Evaporite aquitard), and (3) the deep, confined, underpressured, principally Permian and Pennsylvanian brine aquifer (Deep-Basin Brine aquifer). The first permeable units beneath the thick Permian evaporite section are Wolfcamp strata composed of carbonates, shales, and arkosic sands and gravels (granite wash) having average effective permeability values of 8.9, 1 x 10 -4, and 8.6 md, respectively. Ground water in the Wolfcamp aquifer flows to the northeast toward the semi-impermeable, granitic Amarillo Uplift. This anomalous hydrologic condition (flow toward a low-transmissivity barrier) appears to result from the presence of highly permeable granite-wash deposits that flank the uplift and function as hydrologic sinks.
A two-dimensional finite element model, incorporating different lithologies and their permeabilities as well as leakage values through the overlying Evaporite aquitard, was used to simulate the ground-water flow of the Wolfcamp aquifer. The conditions that best simulate the observed Wolfcamp potentiometric surface are a combination of prescribed heads and no-flow boundaries along the uplift, permeability values of greater than 260 md for the granite-wash deposits that flank the uplift (in contrast to the average value of 8.6 md for the Wolfcamp), and an increased permeability value of 50 md for the highly porous carbonate zone. The best estimate of vertical permeability of the Evaporite aquitard is 8 x 10 -5 md.
Another model treating the deep Permian and Pennsylvanian brine aquifer as a single permeable unit beneath the Evaporite aquitard shows that ground-water flow is to the northeast toward the uplift, and a slightly larger west-to-east flow component appears than that found when considering only flow in Wolfcamp strata. Conditions that most accurately simulate the averaged potentiometric surface are those from the simulation of Wolfcamp strata, which have increased permeability values of 260 md for the Pennsylvanian granite wash close to the uplift and 50 md for the high-porosity Pennsylvanian carbonates.
Keywords: Palo Duro Basin, Deep-Basin Brine aquifer, numerical model, hydrology
CONTENTS
ABSTRACT
INTRODUCTION
Purpose
Scope and limitations
Previous work
GEOLOGIC AND HYDROGEOLOGIC SETTING
Major hydrogeologic units.
Deep-Basin Brine aquifer system
Permian Evaporite aquitard
Upper aquifer
Conceptual ground-water flow model
HYDROGEOLOGIC PROPERTIES OF THE FLOW SYSTEM
Fluid properties
Hydraulic conductivity
Porosity
HYDRAULIC AND BOUNDARY CONDITIONS
Potentiometric surface map of the Ogallala-Dockum aquifer
Potentiometric surface map of the Deep-Basin Brine aquifer
Potentiometric surface map of the Wolfcamp aquifer
Boundary conditions
NUMERICAL SIMULATIONS
General description of numerical modeling
Computer program
Wolfcamp aquifer
Simulation A-1
Simulation A-2
Simulation A-3
Simulations B and C
Simulation D-1
Simulation D-2
Simulation E Leakage across the Evaporite aquitard
Deep-Basin Brine aquifer system
Simulation A
Simulation B
Simulation C
HYDROGEOLOGIC IMPLICATIONS
CONCLUSIONS
ACKNOWLEDGMENTS
REFERENCES
APPENDIX A. Geologic and hydrologic maps
APPENDIX B. Vertically averaged head data for the whole Deep-Basin Brine aquifer
APPENDIX C. Data file for the Deep-Basin Brine aquifer, giving information at 405 finite-element nodal points
Figures
1. Structural features of the Texas Panhandle and adjacent areas
2. Structure-contour map of the top of the crystalline basement, Texas Panhandle
3. Isolith map of Pennsylvanian and Wolfcamp granite wash, Texas Panhandle
4. East-west geologic cross section A-A', Palo Duro Basin, Texas Panhandle
5. Percent lithologic type per stratigraphic unit, Swisher County core test well
6. Regional east-west section illustrating conceptual flow patterns based on hydraulic-head distribution and relative average permeabilities of major hydrogeologic units
7. Weighted-average porosity of Wolfcamp strata, estimated from neutron-density log data
8. Average-head map of the Deep-Basin Brine aquifer constructed from class H data
9. Locations of wells used for class A head data, Deep-Basin Brine aquifer
10. Average-head map of the whole Deep-Basin Brine aquifer constructed from class A data
11. Location of selected class A and class H head data
12. Variogram of 118 selected class A and 42 class H average-head data, Deep-Basin Brine aquifer
13. Potentiometric head map of the Deep-Basin Brine aquifer, Palo Duro Basin, constructed from kriged estimates of head
14. Standard error of estimate of the kriged Deep-Basin Brine head in figure 13
15. Potentiometric surface map of the Wolfcamp aquifer, Palo Duro Basin, constructed from kriged estimates of head
16. Standard error of estimate of the kriged Wolfcamp head
17. Cross section H-H' across the Amarillo Uplift on the northeastern edge of the modeled area
18. Cross section D-D' across the Amarillo Uplift on the northwestern edge of the modeled area
19. Discretized flow region of the Palo Duro Basin
20. Contours of transmissivity, Wolfcamp aquifer simulations A-1 and A-2
21. Contours of computed head, Wolfcamp aquifer simulation A-1
22. Contours of computed head, Wolfcamp aquifer simulation A-2
23. Contours of transmissivity, Wolfcamp aquifer simulations A-3, B, C, D-1, and D-2
24. Contours of computed head, Wolfcamp aquifer simulation A-3
25. Contours of computed head, Wolfcamp aquifer simulation B
26. Contours of computed head, Wolfcamp aquifer simulation C
27. Streamlines and travel times, Wolfcamp aquifer simulation C
28. Contours of computed head, Wolfcamp aquifer simulation D-1
29. Streamlines and travel times, Wolfcamp aquifer simulation D-1
30. Streamlines and travel times, Wolfcamp aquifer simulation D-2
31. Contours of transmissivity, Wolfcamp aquifer simulation E
32. Contours of computed head, Wolfcamp aquifer simulation E
33. Streamlines and travel times, Wolfcamp aquifer simulation E
34. Contours of head difference between the Upper aquifer and the Wolfcamp aquifer
35. Contours of hydraulic gradient through the Evaporite aquitard
36. Contours of evaporite strata thickness
37. Contours of transmissivity, Deep-Basin Brine aquifer simulation A
38. Contours of computed head, Deep-Basin Brine aquifer simulation A
39. Streamlines and travel times, Deep-Basin Brine aquifer simulation A
40. Deep-Basin Brine aquifer simulations B and C
41. Contours of transmissivity, Deep-Basin Brine aquifer simulation B
42. Contours of computed head, Deep-Basin Brine aquifer simulation B
43. Streamlines and travel times, Deep-Basin Brine aquifer simulation B
44. Contours of transmissivity, Deep-Basin Brine aquifer simulation C
45. Contours of computed head, Deep-Basin Brine aquifer simulation C
46. Streamlines and travel times, Deep-Basin Brine aquifer simulation C
Tables
1. Generalized stratigraphic column, Palo Duro Basin
2. Permeability of hydrogeologic units, Palo Duro Basin
3. Porosity of hydrogeologic units, Palo Duro Basin
4. Summary of numerical simulations, Wolfcamp aquifer.
5. Amount of leakage through the Evaporite aquitard computed from results of simulation E
6. Summary of numerical simulations, Deep-Basin Brine aquifer
Appendix Figures
A-1. Structure-contour map of the top of the Mississippian System, Palo Duro Basin
A-2. Isopach map of the Pennsylvanian System, Texas Panhandle
A-3. Net-sandstone map of upper part of the Pennsylvanian System (Canyon and Cisco Groups)
A-4. Net-carbonate map of lower part of the Pennsylvanian System (Bend and Strawn Groups)
A-5. Net-carbonate map of upper part of the Pennsylvanian System (Canyon and Cisco Groups)
A-6. Isopach map of porous carbonate strata in upper part of the Pennsylvanian System
A-7. Isopach map of the Wolfcamp Brown Dolomite, based on sample log information
A-8. Isopach map of the Wolfcamp Series, Palo Duro Basin
A-9. Sandstone isolith map of Wolfcamp strata, Palo Duro Basin
A-10. Percent-carbonate map of Wolfcamp strata, Palo Duro Basin
A-11. Isopach map of porous carbonate strata in Wolfcamp Series
A-12. Structure-contour map of the top of the Wolfcamp Series, Texas Panhandle
A-13. Structure-contour map of the top of the Alibates Formation, Texas Panhandle
A-14. Simplified topographic map of the Palo Duro Basin region
A-15. Head map (1979–1980) of the unconfined Upper aquifer that overlies the Evaporite aquitard in the Palo Duro Basin
Citation
Wirojanagud, Prakob, Kreitler, C. W., and Smith, D. A., 1986, Numerical Modeling of Regional Ground-Water Flow in the Deep-Basin Brine Aquifer of the Palo Duro Basin Texas Panhandle: The University of Texas at Austin, Bureau of Economic Geology, Report of Investigations No. 159, 68 p.
