Reports of Investigations
-
Books & Reports
- Reports of Investigations
- Guidebooks
- Udden Series
- Geological Circulars
- Down To Earth
- Atlases of Major Oil and Gas Reservoirs
- Texas Memorial Museum Publications
- Environmental Geologic Atlas of the Texas Coastal Zone
- Mineral Resource Circulars
- Other Reports
- Seminars and Workshops
- Handbooks
- Submerged Lands of Texas
- Symposia
- Annual Reports
- Open File Reports
-
Maps & Cross Sections
- Thematic Maps
- Miscellaneous Maps, Charts & Sections
- Geologic Atlas of Texas
- STATEMAP Project Maps
- Geologic Quadrangle Maps
- Cross Sections
- Highway Geology Map
- Energy and Mineral Resource Maps
- Shoreline Change and Other Posters
- Wilcox Group, East Texas, Geological / Hydrological Folios
- Bouguer Gravity Atlas of Texas
- River Basin Regional Studies
- Featured Maps
- Posters
- Teachers & the Public
-
Geological Society Publications
- Gulf Coast Association of Geological Societies
- Alabama Geological Society
- Austin Geological Society
- Corpus Christi Geological Society
- Houston Geological Society
- Lafayette Geological Society
- Mississippi Geological Society
- New Orleans Geological Society
- South Texas Geological Society
- GCS SEPM Publications
- Historic BEG & UT Series
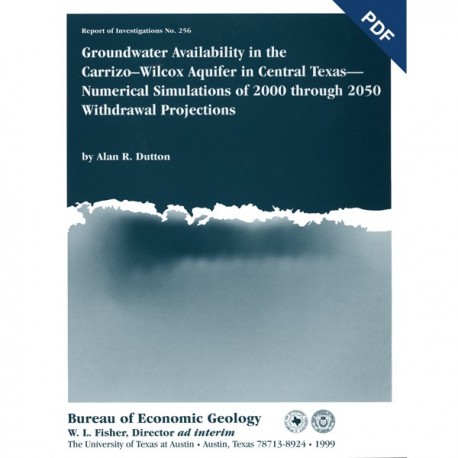
Groundwater Availability in the Carrizo-Wilcox Aquifer in Central Texas. Digital Download
RI0256D
For a print version: RI0256.
RI0256D. Groundwater Availability in the Carrizo-Wilcox Aquifer in Central Texas: Numerical Simulations of 2000 through 2050 Withdrawal Projections, by A. R. Dutton. 53 p., 23 figs., 5 tables, 2 appendices, 1999. doi.org/10.23867/RI0256D. Downloadable PDF.
To purchase a copy of this publication in book format, please order RI0256.
ABSTRACT
Between 1951 and 1996, groundwater pumpage from the Carrizo-Wilcox aquifer, one of Texas' major aquifer systems, increased in the area between the Colorado and Brazos Rivers from approximately 10,600 to 37,900 acre-ft/yr, primarily as a result of mining needs. Continued (and possibly greatly accelerated) growth in groundwater demand for a variety of uses is expected through the year 2050. To assess the general availability of groundwater in the Carrizo- Wilcox aquifer between the Colorado and Brazos Rivers, five groundwater-development scenarios were simulated according to a finite-difference numerical model developed for this study. Simulated water-level change was related to the amount of groundwater withdrawal, its concentration in an area, hydrogeologic properties, and model characteristics. Actual locations and future rates of pumping of water wells, needless to say, might differ from what were simulated. Model calibration by means of historical water-level data had a mean absolute error of 32 ft.
On the basis of the calibrated model, groundwater in the Carrizo-Wilcox aquifer in the study area is predicted to remain available to meet specified withdrawal scenarios through the year 2050 and additional demands after 2050. Except for near the centers of simulated pumping areas, the aquifer units are forecast to remain fully saturated, and simulated water-level decline reflects mainly a change in artesian or pressure head. Simulated rate of decline of hydraulic head, however, is constant through the year 2050, and continued drawdown should be expected as long as pumping remains well above historical rates. Availability of groundwater is also determined by pumping lift, drilling depth, transportation to point of use, and property access, as well as other criteria.
Keywords: aquifer, groundwater, hydrogeologic properties, numerical model
CONTENTS
Abstract
Introduction
Purpose and Objectives
Conceptual Hydrogeologic Model
Data Availability
Hydrostratigraphy
Flow Paths and Flow Rates
Recharge and Discharge
Model Design and Approach
Model Architecture
Aquifer Geometry
Aquifer Parameters
Boundary Conditions
Modeling Sequence and Calibration
Pumping Rates
Future Groundwater-Withdrawal Scenarios
Results
Baseline Historical Simulation (1951 through 1999)
Projected Groundwater-Withdrawal Scenarios (2000 through 2050)
Recommendations
Summary and Conclusions
Acknowledgments
References
Appendix A
Observation wells used for model calibration
Appendix B
Maps showing location of pumping areas used in scenarios, as well as projected 1996
through 2050 drawdown in the Simsboro for scenarios 3 and 4, the difference between
scenarios 3 and 2 in simulated hydraulic head for the Simsboro in 2050, and projected
1996 through 2050 drawdown in the Carrizo for scenario 4
Figures
1. Study area of the Carrizo-Wilcox aquifer in Central Texas
2. Conceptual hydrogeologic model used for constructing the numerical model of groundwater flow
3. Model grid consisting of 74 columns and 42 rows
4. Histograms of hydraulic conductivity measured in well tests in the different formations
5. Histograms of hydraulic conductivity estimated from geophysical well logs in the different
formations
6. Hydraulic-conductivity distribution used to represent the Simsboro Formation in cells of the model
7. Hydraulic-conductivity distribution used to represent the Carrizo Formation in cells of the model
8. Change in total pumping rate from the Carrizo-Wilcox aquifer in Bastrop, Burleson, Fayette, Lee, Milam, and Robertson Counties in study area between 1980 and 1996
9. Location of wells to which pumping rates were specified in historical and baseline future stress periods
10. Simulated potentiometric surface representing groundwater in the Simsboro Formation for the year 1996
11. Southeast-northwest vertical hydrologic dip section A-A' along column 28 and southwest-northeast vertical hydrologic strike section B-B' along row 3 1 of the model
12. Simulated historical drawdown of hydraulic head in the Simsboro Formation
13. Comparison of measured and simulated hydraulic head
14. Projected 1996 through 2050 drawdown in the Simsboro for scenario 1, given pumping rates of the TWDB State Water Plan
15. Projected 1996 through 2050 drawdown in the Simsboro for scenario 2, superposing drawdown associated with pumping areas B and C on that for scenario 1
16. Difference between scenarios 2 and 1 in simulated hydraulic head for the Simsboro Formation in the year 2050, showing incremental effects of pumping areas B and C
17. Projected 1996 through 2050 drawdown in the Simsboro for scenario 5, including cumulative effects of all pumping areas superposed on the pumping rates of the TWDB State Water Plan
18. Projected 1996 through 2050 drawdown in the Carrizo for scenario 5, including cumulative effects of all pumping areas superposed on the pumping rates of the TWDB State Water Plan
19. Difference between scenarios 5 and 1 in simulated hydraulic head for the Simsboro Formation in the year 2050, showing the combined incremental effects of all pumping areas
20. Difference between scenarios 5 and 1 in simulated hydraulic head for the Carrizo Formation in the year 2050, showing the combined incremental effects of simulated withdrawal of Carrizo water mainly from area D but also from area E
21. Incremental drawdown of hydraulic head in the Simsboro, associated with pumping areas A and F in the year 2050
22. Difference between scenarios 5 and 4 in simulated hydraulic head for the Simsboro Formation in the year 2050, showing incremental effects of pumping area E
23. Difference between scenarios 5 and 3 in simulated hydraulic head for the Simsboro Formation in the year 2050, showing incremental effects of pumping area D
Appendix B Figures
B1. Location of pumping areas used in scenarios modeled in this study
B2. Projected 1996 through 2050 drawdown in the Simsboro for scenario 3, including cumulative effects of pumping areas A, B, C, E, and F superposed on the pumping rates of the TWDB State Water Plan
B3. Difference between scenarios 3 and 2 in simulated hydraulic head for the Simsboro Formation in the year 2050, showing the combined incremental effects of pumping areas A, E, and F
B4. Projected 1996 through 2050 drawdown in the Simsboro for scenario 4, including cumulative effects of pumping areas A, B, C, D, and F superposed on the pumping rates of the TWDB State Water Plan
B5. Projected 1996 through 2050 drawdown in the Carrizo for scenario 4, including cumulative effects of pumping areas A, B, C, D, and F superposed on the pumping rates of the TWDB State Water Plan
Tables
1. Groundwater-development scenarios modeled in this study
2. Horizontal and vertical values of hydraulic conductivity assigned to property zones of Carrizo Wilcox model by means of Visual MODFLOW
3. Projected rates of groundwater withdrawal by pumping areas shown in figures 1 and B1
4. Comparison of water-level differences between scenarios
5. Summary of budget for groundwater in Carrizo and Simsboro Formations
Citation
Dutton, A. R., 1999, Groundwater Availability in the Carrizo-Wilcox Aquifer in Central Texas: Numerical Simulations of 2000 through 2050 Withdrawal Projections: The University of Texas at Austin, Bureau of Economic Geology, Report of Investigations No. 256, 53 p. doi.org/10.23867/RI0256D.
