Reports of Investigations
-
Books & Reports
- Reports of Investigations
- Guidebooks
- Udden Series
- Geological Circulars
- Down To Earth
- Atlases of Major Oil and Gas Reservoirs
- Texas Memorial Museum Publications
- Environmental Geologic Atlas of the Texas Coastal Zone
- Mineral Resource Circulars
- Other Reports
- Seminars and Workshops
- Handbooks
- Submerged Lands of Texas
- Symposia
- Annual Reports
- Open File Reports
-
Maps & Cross Sections
- Thematic Maps
- Miscellaneous Maps, Charts & Sections
- Geologic Atlas of Texas
- STATEMAP Project Maps
- Geologic Quadrangle Maps
- Cross Sections
- Highway Geology Map
- Energy and Mineral Resource Maps
- Shoreline Change and Other Posters
- Wilcox Group, East Texas, Geological / Hydrological Folios
- Bouguer Gravity Atlas of Texas
- River Basin Regional Studies
- Featured Maps
- Posters
- Teachers & the Public
-
Geological Society Publications
- Gulf Coast Association of Geological Societies
- Alabama Geological Society
- Austin Geological Society
- Corpus Christi Geological Society
- Houston Geological Society
- Lafayette Geological Society
- Mississippi Geological Society
- New Orleans Geological Society
- South Texas Geological Society
- GCS SEPM Publications
- Historic BEG & UT Series
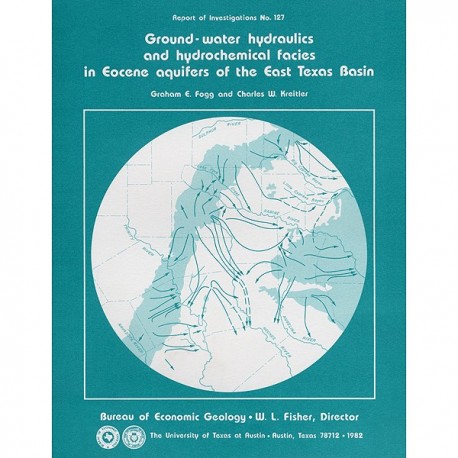
Ground-Water Hydraulics and Hydrochemical Facies in Eocene Aquifers of the East Texas Basin
RI0127
Ground-Water Hydraulics and Hydrochemical Facies in Eocene Aquifers of the East Texas Basin, by G. E. Fogg and C. W. Kreitler. 75 p., 44 figs., 6 tables, 2 appendices, 1982. Print Version.
A free, digital version of this publication can be found on: Texas ScholarWorks
RI0127. Ground-Water Hydraulics and Hydrochemical Facies in Eocene Aquifers of the East Texas Basin, by G. E. Fogg and C. W. Kreitler. 75 p., 44 figs., 6 tables, 2 appendices, 1982.
To purchase this publication as a downloadable PDF, please order RI0127D.
ABSTRACT
Eocene stratigraphic units in the East Texas Basin are composed of a thick sedimentary sequence (approximately 2,000 ft [600 m]) of fresh-water aquifers and aquitards covering an area of approximately 15,000 mi2 (51,000 km2). Analysis of abundant data on hydraulic head, pressure, and water chemistry from water wells tapping the Wilcox, Carrizo, and Queen City aquifers reveals the regional ground-water circulation patterns, locations and mechanisms of major recharge and discharge areas, and evolution of ground-water chemistry.
The Queen City aquifer is primarily a water-table (unconfined) system in which effects of topography create a series of local ground-water basins. The Wilcox-Carrizo aquifer system includes (1) an artesian (confined) section that is separated from the Queen City by the Reklaw Formation, a leaky aquitard, and (2) a water-table (unconfined) system where the Wilcox-Carrizo crops out along the west, north, and east margins of the basin. Structure and topography are major controls on ground-water circulation in the Wilcox-Carrizo. A structural ridge in the Wilcox-Carrizo corresponds roughly to a ground-water divide that separates a southward component of flow from one that is directed northeastward toward the Texas-Louisiana border. Topographically controlled vertical leakage between the Queen City and Wilcox-Carrizo aquifer systems affects circulation in the Wilcox-Carrizo. The vertical head differentials and the distribution of flowing wells indicate downward leakage over most of the basin and upward leakage only beneath the Trinity and Sabine Rivers. Similarly, pressure-versus-depth data from the Wilcox-Carrizo indicate a predominantly downward component of vertical flow that intensifies toward topographically higher areas and reverses direction beneath the Trinity River.
As ground water flows from outcrop down the hydraulic gradient into the artesian part of the Wilcox-Carrizo aquifer, it is consistently altered chemically from an acidic oxidized calcium-magnesium-bicarbonate sulfate water to a basic reduced sodium bicarbonate water. This change in the water chemistry is predominantly controlled by two reactions: calcite dissolution and cation exchange with montmorillonitic clays. Water samples with anomalous chemical composition (compared with regional chemistry) indicate salt dome dissolution or anomalous hydrologic conditions, such as relatively high rates of recharge to the artesian part of the Wilcox-Carrizo through leaky aquitards.
Keywords: aquifers, aquitards, Carrizo aquifer, East Texas Basin, Eocene, ground water, hydraulics, hydrochemistry, Queen City aquifer, Reklaw Formation, Sabine River, Trinity River, Wilcox aquifer
CONTENTS
ABSTRACT
INTRODUCTION
PREVIOUS WORK
SCOPE
HYDROGEOLOGIC SETTING
PHYSIOGRAPHY AND CLIMATE
SURFACE WATER
GEOLOGY RELATED TO GROUND WATER
Midway and Upper Cretaceous strata
Wilcox Group
Carrizo Formation
Reklaw Formation
Queen City Formation
Weches and Sparta Formations
Alluvium
Structural setting
GROUND-WATER PUMPAGE AND USE
AQUIFER PARAMETERS
AQUIFER HYDRAULICS
QUEEN CITY
WILCOX-CARRIZO
Potentiometric surface map
Impacts of topography
Impacts of geology and pumpage
Vertical leakage across the Reklaw aquitard
Vertical flow in the Wilcox-Carrizo system
Rate of ground-water flow
SUMMARY-AQUIFER HYDRAULICS.
WATER CHEMISTRY
PIPER DIAGRAMS OF QUEEN CITY-SPARTA AND WILCOX-CARRIZO WATER
DEVELOPMENT OF SODIUM BICARBONATE WATER
SULFATE REDUCTION AND REDUCING CONDITIONS
SILICA
CHLORIDE
SUMMARY-EVOLUTION OF WATER CHEMISTRY
EVOLUTION OF GROUND-WATER COMPOSITION AS A TRACER FOR GROUND-WATER FLOW
TOTAL DISSOLVED SOLIDS
Methods
Results
Discussion
IMPLICATIONS FOR TRANSPORT OF GROUND-WATER CONTAMINANTS
ACKNOWLEDGMENTS
REFERENCES
APPENDIX A: TRENDS IN GROUND-WATER USE, EAST TEXAS BASIN
APPENDIX B: BASIC AXIOMS OF PRESSURE-VERSUS-DEPTH INTERPRETATION
FIGURES
1. Location and structural features of the East Texas
2. Stratigraphic column and composite log of Tertiary formations, Smith County, East Texas Basin
3. Topographic map showing major reservoirs and locations of stream-flow gaging stations
4. Surface geology, East Texas Basin
5. Structural cross sections A-A', B-B', and C-C', showing Tertiary and Upper Cretaceous formations, East Texas Basin
6. Net-sand-thickness map, Wilcox Group
7. Percent-sand-thickness map, Wilcox Group
8. Mean net-clay-thickness map, Reklaw aquitard
9. Structure map, top of Wilcox Group
10. Mean transmissivity map, Sparta, Queen City, Carrizo, Wilcox, and Cypress aquifers
11. Plots of transmissivity and hydraulic conductivity versus sand-percent and net-sand values, Wilcox aquifer
12. Potentiometric levels, Queen City aquifer
13. Potentiometric surface, Wilcox-Carrizo aquifer system
14. Ground-water flow lines drawn from the Wilcox-Carrizo potentiometric surface
15. Topographically controlled leakage across an aquitard
16. Vertical head differentials measured between Queen City and Wilcox-Carrizo aquifers.
17. Profiles showing elevations of Wilcox-Carrizo water levels above major stream beds, Sabine River, Neches River, and Trinity River
18. Method of computing pressure head from conventional water-well data
19. Pressure-versus-depth plot of all data from the Wilcox-Carrizo system
20. Pressure versus depth for areas within 2 mi (3.2 km) of Trinity River, Neches River, and Sabine River
21. Mean slope of pressure-versus-depth regression lines versus land-surface elevation
22. Piper diagram of water chemistry, Queen City and Sparta aquifers
23. Piper diagram of water chemistry, Wilcox-Carrizo aquifer
24. Piper diagram of water chemistry from water wells screened shallower than 150 ft (46 m), Wilcox-Carrizo aquifer
25. Piper diagram of water chemistry from water wells screened deeper than 150 ft (46 m), Wilcox-Carrizo aquifer
26. Generation of Na+-HCO3- ground water, Wilcox-Carrizo aquifer
27. Graph of Ca2+versus depth, Wilcox-Carrizo aquifer
28. Map view of Ca2+concentrations, Wilcox-Carrizo aquifer
29. Graph of pH versus total carbonate activity
30. Graph of pH versus depth, Wilcox-Carrizo aquifer
31. Map view of pH values, Wilcox-Carrizo aquifer
32. Graph of SO42-activity versus depth, Wilcox-Carrizo aquifer
33. Map view of SO42-concentrations. Wilcox-Carrizo aquifer.
34. Map view of SiO2 concentrations, Wilcox-Carrizo aquifer
35. Graph of H4SiO2 versus depth
36. Graph of H4SiO4 activities versus saturation indices of amorphous Si02 and quartz
37. Graph of Cl- activities versus depth, Wilcox-Carrizo aquifer
38. Map view of Cl- concentrations, Wilcox-Carrizo aquifer
39. Graph of SO42-activities versus depth, Carrizo aquifer
40. Graph of Cl- activities versus depth, Carrizo aquifer
41. Graph of Cl- concentrations versus depth, Gregg County, Texas
42. Map showing distribution of percent fresh water, Wilcox aquifer
43. Map showing distribution of fresh-water percentages having values less than 40 percent, the trends of high sand percent, and the Elkhart Graben-Mount Enterprise fault system
44. Induction-resistivity and spontaneous-potential curves for Wilcox aquifer near Oakwood Dome
TABLES
1. Flow characteristics of major rivers in the East Texas Basin
2. Water use in the East Texas Basin, 1974
3. Aquifer properties
4. Linear regression statistics for the Wilcox-Carrizo pressure-versus-depth data from confined and unconfined sections and 50-ft (15.2-m) intervals of land-surface elevation within each county
5. Linear regression statistics for the Wilcox-Carrizo pressure-versus-depth data from areas within 2 mi (3.7 km) of the major rivers
6. Water chemistry from wells in the Carrizo aquifer near flanks of Oakwood and Keechi salt domes
Citation
Fogg, G. E., and Kreitler, G. E., 1982, Ground-Water Hydraulics and Hydrochemical Facies in Eocene Aquifers of the East Texas Basin: The University of Texas at Austin, Bureau of Economic Geology, Report of Investigations No. 127, 75 p.
