Reports of Investigations
-
Books & Reports
- Reports of Investigations
- Guidebooks
- Udden Series
- Geological Circulars
- Down To Earth
- Atlases of Major Oil and Gas Reservoirs
- Texas Memorial Museum Publications
- Environmental Geologic Atlas of the Texas Coastal Zone
- Mineral Resource Circulars
- Other Reports
- Seminars and Workshops
- Handbooks
- Submerged Lands of Texas
- Symposia
- Annual Reports
- Open File Reports
-
Maps & Cross Sections
- Thematic Maps
- Miscellaneous Maps, Charts & Sections
- Geologic Atlas of Texas
- STATEMAP Project Maps
- Geologic Quadrangle Maps
- Cross Sections
- Highway Geology Map
- Energy and Mineral Resource Maps
- Shoreline Change and Other Posters
- Wilcox Group, East Texas, Geological / Hydrological Folios
- Bouguer Gravity Atlas of Texas
- River Basin Regional Studies
- Featured Maps
- Posters
- Teachers & the Public
-
Geological Society Publications
- Gulf Coast Association of Geological Societies
- Alabama Geological Society
- Austin Geological Society
- Corpus Christi Geological Society
- Houston Geological Society
- Lafayette Geological Society
- Mississippi Geological Society
- New Orleans Geological Society
- South Texas Geological Society
- GCS SEPM Publications
- Historic BEG & UT Series
Flow-Unit Characterization and Recovery Optimization of a..Reservoir, Tirrawarra Oil Field. Digital Download
RI0231D
For a print version: RI0231.
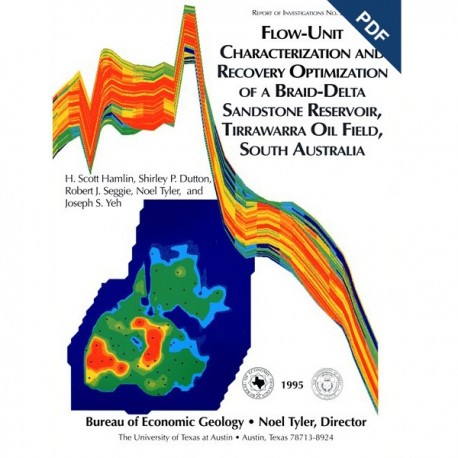
RI0231D. Flow-Unit Characterization and Recovery Optimization of a Braid-Delta Sandstone Reservoir, Tirrawarra Oil Field, South Australia, by H. S. Hamlin, S. P. Dutton, R. J. Seggie, Noel Tyler, and J. S. Yeh. 44 p., 49 figs., 6 tables, 1995. doi.org/10.23867/RI0231D. Downloadable PDF.
To purchase this publication in book format, please order RI0231.
ABSTRACT
The Tirrawarra Sandstone is the primary producing zone at Tirrawarra field in the Cooper Basin of South Australia, where it contains 146 million barrels (MMbbl) of unrecovered oil. Because previous reservoir models had failed to predict reservoir performance accurately and development drilling had yielded poor results, we undertook this study in order to construct a three-dimensional descriptive model of the Tirrawarra Sandstone reservoir, within which we calculated the volumes and residency of original and remaining oil in place. This depositional-facies-based flow-unit model resulted in the identification of an additional 36 MMbbl of oil in place and proved crucial to our understanding of past reservoir behavior and to our identifying opportunities for incremental development. A comprehensive subsurface data base, including 3,000 ft of core from 31 wells, was used to develop the flow-unit model.
The Carboniferous-Permian Tirrawarra Sandstone reservoir, which was deposited in a proglacial intracratonic setting, is 90 to 180 ft thick, and it comprises four main depositional facies that record progradation of several fluvial-deltaic systems across a lacustrine basin. A braid-delta system, the core of the reservoir, is dominated by bed-load fluvial channel-fill sandstone and is bounded by more lithologically heterogeneous facies. Prodelta, delta-front, distributary-channel, and channel-mouth-bar facies underlie the braid-delta facies, which are truncated and overlain by braid-plain facies. The Tirrawarra Sandstone is primarily a fine- to medium-grained sublitharenite, although each facies has distinct petrographic characteristics. Texture and detrital composition, both inherited from the depositional environment, determined the magnitude of porosity loss during diagenesis.
Depositional environment is the primary control on reservoir properties and productivity at Tirrawarra field. Each facies has distinctive petrophysical properties and displays characteristic geometries and internal stratification patterns. We defined reservoir flow units within each facies on the basis of stratigraphic position and petrophysical properties. Stratigraphic analysis, by means of well log and core data, established flow-unit architecture and delineated flow barriers. Petrographic and petrophysical analyses quantified flow-unit-specific properties such as porosity, permeability, and hydrocarbon saturation. We then used geological and petrophysical data to construct the three-dimensional model, which enhanced visualization of reservoir heterogeneities, performed volumetric calculations, and served asa basis for developing strategies to optimize recovery. The model identified undeveloped pay in all major flow units and revealed untapped reservoir compartments in the north part of the field. Geologically targeted infill wells and recompletions will improve recoveryefficiency in existing enhanced-oil-recovery (EOR) patterns, and the northern reservoir compartments will be accessed by new EOR patterns.
Keywords: Australia, braided streams, Cooper Basin, deltaic sedimentation, diagenesis, enhanced recovery, petroleum, reservoir rocks, sandstone, Tirrawarra Sandstone
CONTENTS
Abstract
Introduction
Methodology
Geologic Setting
Depositional Facies
Facies Descriptions
Interpretations
Reservoir Flow Units
Reservoir Architecture
Flow Unit 1U
Flow Units 2L and 2U
Flow Units 3L and 3U
Flow Unit 4
Sandstone Composition
Texture
Framework Mineralogy
Matrix
Cements and Replacive Minerals
Quartz
Authigenic Clays
Siderite.
Porosity
Diagenetic Bands
Petrographic Controls on Reservoir Quality
Summary of Facies-Related Reservoir Properties
Three-Dimensional Reservoir Modeling
Petrophysics
Production Analysis
Opportunities for Incremental Development
Conclusions
Acknowledgments
References
Figures
-
Location map of Cooper Basin and Tirrawarra oil field in east-central Australia
-
Map of Tirrawarra field showing well locations, lines of sections, wells having Tirrawarra Sandstone core, and boundary of the three-dimensional model
-
Structure map of Tirrawarra field contoured on top of a coal bed that overlies the Tirrawarra Sandstone reservoir
-
Carboniferous through Triassic stratigraphy of the Cooper Basin
-
Core description, log responses, petrophysical properties, interpreted depositional environments, and reservoir flow units of the Tirrawarra Sandstone at Tirrawarra field
-
Photograph of core from facies 1 and 2
-
Photographs of core from facies 3
-
Photograph of core from facies 4
-
Photograph of core from facies 4 at the base
-
Depositional models of Tirrawarra Sandstone facies
-
Histographs of porosity distribution in each flow unit
-
Histographs of permeability distribution in each flow unit
-
Scatterplots of porosity versus permeability in each flow unit
-
Graph of average porosity versus average permeability in each Tirrawarra flow unit
-
Typical mercury-injection capillary-pressure curves from each flow unit
-
Typical pore-throat size distribution curves of each flow unit transformed from capillary pressures
-
Schematic south-north and west-east cross sections A-A' and B,B', respectively, Showing Tirrawarra flow units
-
lsopach map of Tirrawarra flow unit 1U
-
lsopach map of Tirrawarra flow unit 2L
-
lsopach map of Tirrawarra facies 3, which includes both flow units 3 L and 3U
-
Net-porous-sandstone map of Tirrawarra flow unit 3L 1
-
Net-porous-sandstone map of Tirrawarra flow unit 3U
-
lsopach map of Tirrawarra flow unit 4
-
Compositional classification of Tirrawarra Sandstone by flow unit
-
Relative proportions of quartz, siderite, and kaolinite cements by flow unit
-
Generalized paragenetic sequence of Tirrawarra Sandstone
-
Graph showing quartz-cement volume decreasing as proportion of detrital rock fragments increases
-
Graph showing positive correlation between volume of quartz cement and primary porosity
-
Thin-section photograph showing illite fibers inside secondary pore
-
SEM photograph showing illite fibers and flakes lining primary pores and extending into and across secondary pores
-
Thin-section photograph showing kaolinite and illite in altered and partly dissolve rock fragment
-
SEM photograph showing large cluster of kaolinite crystals in secondary pore
-
Relative proportions of primary and secondary porosity and microporosity by flow unit
-
Photograph of core showing white diagenetic band in flow unit 3L sandston
-
Graphs showing relationships between permeability and grain size or volume of rock fragments
-
Thin-section photograph of flow unit 1 U sandstone showing laminations
-
Thin-section photograph of flow unit 2L sandstone showing ductile grain deformation, kaolinite in secondary pores, and siderite replacement of framework grains
-
Thin-section photograph of flow unit 3L sandstone showing primary pores and quartz overgrowth
-
SEM photograph of 3L sandstone showing abundant primary porosity and well-developed quartz
overgrowths -
Thin-section photograph of flow unit 3U sandstone showing fewer primary pores than in flow unit 3L
-
Thin-section photograph of high-permeability sandstone from flow unit 4 showing primary and secondary pores
-
Thin-section photograph of low-permeability sandstone from flow unit 4 showing less primary porosity
-
Fence diagram from 3-D reservoir model showing Tirrawarra flow units
-
Structural cross sections from 3-D model showing porosity distributio
-
Structural cross sections from 3-D model showing permeability distributi
-
Structural cross sections from 3-D model showing water saturation distribution
-
Maps from 3-D model showing hydrocarbon pore volume in the main flow units
-
Contour map of initial oil production rates from Tirrawarra wells, also showing selected structural contours
-
Map of Tirrawarra field showing existing and potential future EOR patterns and infill drilling and recompletion locations
Tables
1. Tirrawarra Sandstone oil reservoir, Tirrawarra field, reservoir properties
2. Characteristics of Tirrawarra Sandstone depositional facies
3. Petrophysical properties of Tirrawarra flow units from core measurements
4. Comparison of petrographic features by flow unit
5. Distribution of original oil in place in Tirrawarra field
6. Distribution of remaining oil in place in Tirrawarra field
Citation
Hamlin, H. S., Dutton, S. P., Seggie, R. J., Tyler, Noel, and Yeh, J. S., 1995, Flow-Unit Characterization and Recovery Optimization of a Braid-Delta Sandstone Reservoir, Tirrawarra Oil Field, South Australia: The University of Texas at Austin, Bureau of Economic Geology, Report of Investigations No. 232, 44 p. doi.org/10.23867/RI0231D.
