Reports of Investigations
-
Books & Reports
- Reports of Investigations
- Guidebooks
- Udden Series
- Geological Circulars
- Down To Earth
- Atlases of Major Oil and Gas Reservoirs
- Texas Memorial Museum Publications
- Environmental Geologic Atlas of the Texas Coastal Zone
- Mineral Resource Circulars
- Other Reports
- Seminars and Workshops
- Handbooks
- Submerged Lands of Texas
- Symposia
- Annual Reports
- Open File Reports
-
Maps & Cross Sections
- Thematic Maps
- Miscellaneous Maps, Charts & Sections
- Geologic Atlas of Texas
- STATEMAP Project Maps
- Geologic Quadrangle Maps
- Cross Sections
- Highway Geology Map
- Energy and Mineral Resource Maps
- Shoreline Change and Other Posters
- Wilcox Group, East Texas, Geological / Hydrological Folios
- Bouguer Gravity Atlas of Texas
- River Basin Regional Studies
- Featured Maps
- Posters
- Teachers & the Public
-
Geological Society Publications
- Gulf Coast Association of Geological Societies
- Alabama Geological Society
- Austin Geological Society
- Corpus Christi Geological Society
- Houston Geological Society
- Lafayette Geological Society
- Mississippi Geological Society
- New Orleans Geological Society
- South Texas Geological Society
- GCS SEPM Publications
- Historic BEG & UT Series
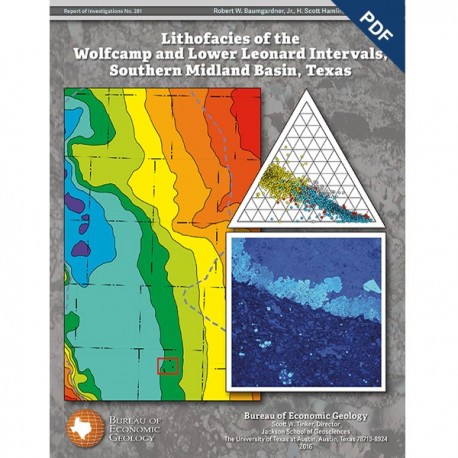
Lithofacies of the Wolfcamp and Lower Leonard Intervals, Southern Midland Basin, Texas. Digital Download
RI0281D
For a print version: RI0281.
RI0281D. Lithofacies of the Wolfcamp and Lower Leonard Intervals, Southern Midland Basin, Texas, by R. W. Baumgardner, Jr., H. S. Hamlin, and H. D. Rowe. 67 p., 41 figs., 5 tables, 1 appendix, 2016. doi.org/10.23867/ri0281D. Downloadable PDF.
To purchase this publication in book format, please order RI0281.
To purchase this item on USB, please order RI0281USB.
VIDEO: Meet The Author: Robert Baumgardner discusses RI 281. (6 minutes)
About This Publication
This report, conceived as a follow-up to regional treatment of the Wolfberry depositional systems in Report of Investigations No. 277, focuses on basinal facies of the lower Leonard and Wolfcamp intervals in the southern Midland Basin. The report provides detailed lithologic information about mudrocks and associated facies that were largely ignored before they became prolific producers of hydrocarbons as a result of hydraulic fracturing and horizontal drilling. Readers interested in the regional view presented in RI 277, and those seeking detailed lithologic information about the so-called Wolfcamp A and B zones, should find value in the core-based descriptions of lithofacies in this report, which examines the most continuous basinal cores publicly available from the Lower Permian/Upper Pennsylvanian interval in the Midland Basin. Detailed core description (including thin-section analysis)—combined with total organic carbon (TOC) sampling, handheld XRF scanning, and micro-rebound hammer testing at 1-ft spacing (techniques applied to these cores for the first time)—reveals significant, facies-related differences in TOC content, mineralogy, and rock strength. In addition, programmed pyrolysis (Rock-Eval®) analysis reveals that most kerogen in the lower Leonard/Wolfcamp interval is in the oil-production window and has matured to Type II–III (“oil-gas prone”). Stratigraphers as well as explorationists will find information here to improve their understanding of Permian-age basinal mudrocks in the Midland Basin.
ABSTRACT
Basinal mudrocks and associated facies assigned to the Wolfcamp and lower Leonard lithostratigraphic units in the Midland Basin are prolific producers of oil and gas. Four facies are recognized in core on the basis of macroscopic examination, XRD analysis, and ED-XRF elemental chemistry: (1) siliceous mudrock, (2) calcareous mudrock, (3) muddy bioclast–lithoclast floatstone, and (4) skeletal wackestone/packstone. Mudrocks are largely hemipelagic deposits of fine-grained sediment delivered by suspension settling. Floatstones were deposited by debris flows that originated on carbonate shelves around the basin.
Wackestones/packstones are finer grained sediment density-flow deposits, probably turbidites, reworked by local bottom currents. These sediments were deposited below storm wave base in a basin having limited connection to the open ocean. During deposition, low-oxygen conditions prevailed in bottom waters and sediments, as shown by the presence of agglutinated foraminifera, rarity of burrows, widespread prevalence of small (<6 μm) pyrite framboids, presence of phosphatic nodules, and elevated molybdenum concentrations. Total organic carbon (TOC) content reaches 6.8 percent. TOC is facies-dependent (highest in siliceous mudrock) and varies widely within small vertical distances. Cyclicity is evident in individual meter-thick, upward-fining cycles of floatstone or wackestone/packstone overlain by calcareous and siliceous mudrock. Rock strength increases as calcite content increases, likely as a result of diagenetic cementation. Most kerogen in the lower Leonard–Wolfcamp interval is in the oil-production window and has matured to Type II–III (“oil–gas prone”). Based on their TOC and hydrogen content, siliceous mudrocks have the highest potential for hydrocarbon generation.
Keywords: basinal mudrocks, cyclicity, organic matter, Pennsylvanian, Permian, Reagan County, Rock-Eval®, rock strength, stratigraphy
CONTENTS
Abstract
Introduction
Stratigraphic nomenclature
Previous Work
Regional Setting
Late Pennsylvanian–Early Permian paleoclimate and sea level
Tectonics
Methods
Compositional Analysis
Lithofacies
Siliceous mudrock facies
Calcareous mudrock facies
Summary of mudrock facies
Muddy bioclast–lithoclast floatstone facies
Description of matrix
Description of clasts
Skeletal wackestone/packstone facies
Description of matrix
Description of clasts
Concretions
Organic matter production, accumulation, and preservation
Production of organic matter
Accumulation/dilution of organic matter
Preservation/decomposition of organic matter
Biotic indicators
Phosphatic nodules
Pyrite framboids
Molybdenum
Facies Interpretation and Depositional Processes
Depositional Model
Cyclicity
Meter-scale cycles
Origins of cyclicity
Reservoir Properties
Rock strength and fractures
Programmed pyrolysis analysis.
Discussion
Conclusions
Acknowledgments
References
Appendix
Figures
1. Principal structural elements of Midland Basin area in Permian time
2. Stratigraphic and operational names of formations in the study area
3. Structure map on top of Pennsylvanian rocks underlying the Wolfcamp interval
4. Isopach map of Wolfcamp interval within boundaries of the Midland Basin
5. Isopach map of the lower Leonard interval within boundaries of the Midland Basin
6. Paleogeographic map of southwestern United States during late Wolfcampian time
7. Interpretations of paleoclimate during Wolfcampian–early Leonardian time
8. Schematic cross section of southwestern margin of Midland Basin
9. Map of selected fields and wells in allochthonous carbonate deposits in Wolfcamp and lower Leonard
10. Wireline logs of four study wells showing cored intervals in this report
11. Scatterplots of ED-XRF elemental results and XRD mineralogical data from O. L. Greer 1 core
12. Scatterplots of elemental geochemistry from ED-XRF results
13. Ternary diagrams based on XRF and XRD data
14. Photographs of slabbed core showing interpreted facies
15. Facies interpreted from O. L. Greer 1 core
16. Facies interpreted in six cored intervals in the O. L. Greer 2 well
17. Facies interpreted from four cored intervals in Rupert P. Ricker 1 well
18. Facies in the lower Leonard interpreted from R. Ricker 1 core
19. Photographs of siliceous mudrock facies
20. Photographs of siliceous mudrock features
21. Photographs of calcareous mudrock facies
22. Photographs of calcareous mudrock facies
23. Photomicrographs of muddy bioclast–lithoclast floatstone facies in Wolfcamp
24. Photographs of muddy bioclast–lithoclast floatstone facies
25. Photographs of skeletal wackestone/packstone facies
26. Photographs of skeletal wackestone/packstone facies
27. Northeast–southwest cross section showing distinctive package of three correlative carbonate beds in lower Wolfcamp
28. Map of three distinctive correlative carbonate-rich beds in lower Wolfcamp
29. Photographs of carbonate concretion in calcareous mudrock facies in Wolfcamp
30. Crossplot of Ni and TOC values for O. L. Greer 1 and R. Ricker 1 wells
31. Depth plot of total organic carbon in O. L. Greer 1 core and parts of R. Ricker 1 core
32. Form of pyrite and size of pyrite framboids relative to redox conditions
33. Schematic cross section showing allochthonous carbonate deposits in upper Wolfcamp
34. Depositional model of basinal sediments described in this study
35. Plots showing correlative cycles in the O. L. Greer 1 and R. Ricker 1 wells
36. Graph of estimated rock strength, or unconfined compressive strength (UCS), in MPa
37. Graphs of estimated rock strength (UCS) compared to mineral content of facies
38. Photographs of natural, cement-filled fractures in core
39. Crossplot of hydrogen index vs. Tmax
40. Crossplot of S2 and TOC
41. Crossplot of vitrinite reflectance equivalency (%Roe) vs. depth
Tables
1. Basinal facies in cores from Wolfcamp and lower Leonard in northern Reagan County, Texas
2. Average weight percent of minerals in matrix (not clasts) of each facies
3. Total organic carbon data in weight percent
4. Whole rock visual maceral estimates (on samples from sample half of O. L. Greer 1 core)
5. Values of estimated unconfined compressive strength (UCS) for facies in this study
Citation
Baumgardner, R. W. Jr., Hamlin, H. S., and Rowe, H. D., 2016, Lithofacies of the Wolfcamp and Lower Leonard Intervals, Southern Midland Basin, Texas: The University of Texas at Austin, Bureau of Economic Geology, Report of Investigations No. 281, 67 p. doi.org/10.2386/RI0281D.
