Reports of Investigations
-
Books & Reports
- Reports of Investigations
- Guidebooks
- Udden Series
- Geological Circulars
- Down To Earth
- Atlases of Major Oil and Gas Reservoirs
- Texas Memorial Museum Publications
- Environmental Geologic Atlas of the Texas Coastal Zone
- Mineral Resource Circulars
- Other Reports
- Seminars and Workshops
- Handbooks
- Submerged Lands of Texas
- Symposia
- Annual Reports
- Open File Reports
-
Maps & Cross Sections
- Thematic Maps
- Miscellaneous Maps, Charts & Sections
- Geologic Atlas of Texas
- STATEMAP Project Maps
- Geologic Quadrangle Maps
- Cross Sections
- Highway Geology Map
- Energy and Mineral Resource Maps
- Shoreline Change and Other Posters
- Wilcox Group, East Texas, Geological / Hydrological Folios
- Bouguer Gravity Atlas of Texas
- River Basin Regional Studies
- Featured Maps
- Posters
- Teachers & the Public
-
Geological Society Publications
- Gulf Coast Association of Geological Societies
- Alabama Geological Society
- Austin Geological Society
- Corpus Christi Geological Society
- Houston Geological Society
- Lafayette Geological Society
- Mississippi Geological Society
- New Orleans Geological Society
- South Texas Geological Society
- GCS SEPM Publications
- Historic BEG & UT Series
Resource Optimization...Characterization of Downdip Frio Shoreface/Shelf Sandstone Reservoirs: Red Fish Bay Field, South
RI0248
For a downloadable, digital version: RI0248D.
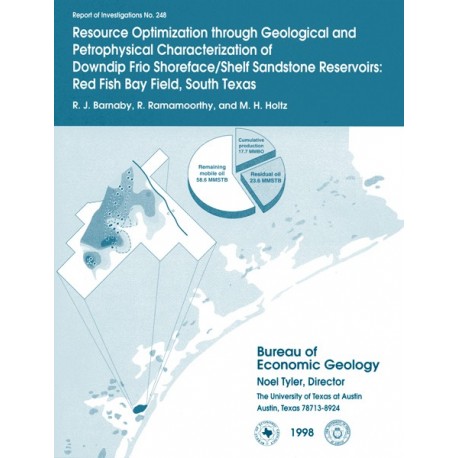
RI0248. Resource Optimization through Geological and Petrophysical Characterization of Downdip Frio Shoreface/Shelf Sandstone Reservoirs: Red Fish Bay Field, South Texas, by R. J. Barnaby, R. Ramamoorthy, and M. H. Holtz. 61 p., 38 figs., 2 tables, 1998. Print.
To purchase this publication as a downloadable PDF, please order RI0248D.
About This Publication
Located in Nueces County, 5 mi southeast of Aransas Pass in Corpus Christi Bay, Red Fish Bay field has yielded more than 19 MMbbl of liquid hydrocarbons and 103 Bcf of gas from more than 50 stacked Frio Sandstone reservoirs since field discovery in 1950. This study forcused on delineating bypassed hydrocarbons in 19 upper Frio reservoirs.
ABSTRACT
Red Fish Bay field exemplifies the tremendous bypassed hydrocarbon potential in supposedly depleted sandstone reservoirs of the Downdip Frio Barrier/Strandplain Sandstone on the San Marcos Arch play in South Texas. The field is located in Nueces County, 5 mi southeast of Aransas Pass in Corpus Christi Bay. Since field discovery in 1950, Red Fish Bay field has yielded more than 19 million barrels (MMbbl) of liquid hydrocarbons (oil and gas condensate) and 103 billion cubic feet (Bcf) of gas from more than 50 stacked Frio sandstone reservoirs. The trapping mechanism is an anticlinal closure on the footwall of a regional growth fault, in addition to a facies change to more shaly sediments to the east and southeast. An additional 640 Bcf of gas and 395 thousand barrels (Mbbl) of gas condensate have been produced from the more laterally extensive Common 10 reservoir, which extends to Mustang Island field, 3 mi southeast of Red Fish Bay field.
This study focused on delineating bypassed hydrocarbons in upper Frio reservoirs in Red Fish Bay field. The 19 reservoirs targeted by this study account for 80 percent of total field production, although these reservoirs were recently abandoned in favor of deeper Frio targets. The upper Frio sandstone reservoirs are 7,300 to 8,500 ft deep and consist of stacked and amalgamated shoreface to inner-shelf sandstones interbedded with shelf siltstones and mudstones. Stratigraphic analysis, geological mapping, and evaluation of well-log and production data document underexploited regions within most of the oil and gas reservoirs.
Although most of the 182 exploration and development wells have only old electric logs available, 8 wells of post- 1970's vintage have complete logging suites. These eight key wells were subjected to detailed petrophysical analysis. Analytical results were compared with available core data to corroborate the log interpretations, and a log response data base was established to allow extrapolation of the petrophysical analysis to the remaining older wells throughout the field. Mapping of log-derived porosity and hydrocarbon saturation values confirms the bypassed hydrocarbon opportunities delineated by geologic mapping. Moreover, the eight key wells targeted deeper Frio pay and postdate abandonment of the upper Frio reservoirs. Analysis of these logs confirms that bypassed hydrocarbons remain within the upper Frio reservoirs, and 21 upper Frio recompletion opportunities were identified in currently active wells. During late 1997, the operator acted on one of our recommended recompletion opportunities. This well tested at 200 barrels per day (bbl/d) and was completed to produce 80 bbl/d. The additional production from this well also represents an increase of more than 200 percent from the 60-bbl/d total field production at the time of this study.
Average recovery efficiencies are 12 percent for oil reservoirs under primary depletion, 25 percent for waterflooded oil reservoirs, and nearly 50 percent for underexploited gas reservoirs. Conservative estimates of the remaining hydrocarbon potential indicate that 37.5 million stock-tank barrels (MMSTB) of oil remains in the 17 nonwaterflooded oil reservoirs exclusive of zones 5-A and 5-B and 14 Bcf of gas remains in the underexploited (<85 percent recovery) gas reservoirs. The better developed oil and gas reservoirs have attained primary recovery efficiencies of approximately 25 and 90 percent, respectively. Using these primary recovery factors, recommended recompletion and infill drilling strategies are expected to add an estimated 7 MMSTB of oil and 11 Bcf of gas to the ultimate recovery from Red Fish Bay field. An estimated 52 MMSTB of mobile oil will remain in all of the studied oil reservoirs after attainment of these recovery factors. Implementation of secondary and tertiary recovery programs should further increase ultimate hydrocarbon recovery.
Keywords: Corpus Christi Bay, field development, Frio Formation, Gulf Coast, log analysis, Nueces County, oil and gas reservoirs, Oligocene, Red Fish Bay field, reservoir characterization, structural and stratigraphic traps, Texas
CONTENTS
Abstract
Introduction
Objectives
Data Base
Methodology
Geology
Structure
Regional Depositional Setting
Stratigraphy
Sandstone Thickness Trends and Log Facies Distribution
Interpretation of Depositional Environments
Petrophysical Analysis
Data Preparation
Log Digitization and Editing
Log Normalization
Recalibration of Log Data
Examples of Log Errors Delineated by Cross Plots and Corrective Procedures
Petrophysical Evaluation
Corroboration with Core Data
Petrophysical Property Estimation of Nonkey Wells
Delineation of Bypassed Oil and Gas Potential
Data Integration and Mapping
Volumetrics Estimation Recovery of Remaining Hydrocarbons
Summary
Acknowledgments
References
Figures
1. Location map of Red Fish Bay field, Nueces County, South Texas, and the major hydrocarbon fields in the Downdip Frio Barrier-Strandplain Sandstone on the San Marcos Arch play
2. Stratigraphic column for Cenozoic siliciclastic rocks of the northwestern Gulf Coast showing major formations and their relation to sea-level fluctuation and depositional episodes
3. Frio Formation depositional setting for Texas Gulf Coast region
4. Structure map, top of Frio Formation in Red Fish Bay field area
5. Base map, Red Fish Bay field, showing Texas State Tract boundaries and well locations
6. Type log (TST 423 Sunray No. 12) for Red Fish Bay field upper Frio
7. Production history for reservoirs targeted by this study compared with the total production from Red Fish Bay field
8. Regional dip stratigraphic section A-A' showing major correlations and updip to downdip facies distribution
9. Net-sandstone isopach map for zone 14 with SP log traces
10. Base map of Red Fish Bay field showing locations of eight key wells with the most complete logging suites
11. Zone 10, LO. sandstone reservoir maps
12. Zone 9 sandstone reservoir maps
13. Zone 8 sandstone reservoir maps
14. Zone 14, UP. and 14, UP, N sandstone reservoir maps
15. Zone 14 and 14-A sandstone reservoir maps
16. Zone 15, 15-A, and 15 UP sandstone reservoir maps
17. Zone 17, UP sandstone reservoir maps
18. Zone 17 sandstone reservoir maps
19. Zone 17 L and 17, LO, sandstone reservoir maps
20. Schematic structural cross section of hydrocarbon fields in Corpus Christi Bay area showing interpreted fluid migration pathways
21. Depositional model for shoreface to inner-shelf sandstone
22. Multiwell cross plots of log-derived effective porosity versus SP response and computed QVSP for the eight key wells
23. Multiwell cross plots of SP versus GR log response for the eight key wells
24. Multiwell cross plots of and AT versus and pb versus AT and log response data for the eight key wells
25. Log response data for the eight key wells
26. Multiwell cross plots of AT versus log response data for the eight key wells
27. Example of ELAN output for key well TST 396 Atlantic No. 8 displaying estimation of porosity, permeability, fluid volumes, and mineralogy
28. Comparison of effective porosity computed from ESTIME using increasing amounts of log data input versus ELAN-derived estimates of effective porosity using all available logs for key well TST 423 Sunray No. 10
29. Cross plot of well log response data base of effective porosity versus QVSP data for zone 8 reservoir sandstone
30. Probability distribution of initial water saturation values and residual oil saturation values compiled from Bureau of Economic Geology data base for similar reservoirs
31. Hydrocarbon volumetric estimates for Red Fish Bay field reservoir zone 8
32. Estimated hydrocarbon resource volumetrics in Red Fish Bay field
33. Resistivity and SP logs for TST 421 Getty No. 1 along with ELAN-derived estimates of clay, sandstone, and fluid volumes
34. Resistivity and SP logs for shallow interval in TST 422 Getty No. 6 along with ELAN-derived estimates of clay, sandstone, and fluid volumes
35. Resistivity and SP logs for deep interval in TST 422 Getty No. 6 along with ELAN-derived estimates of clay, sandstone, and fluid volumes
36.Resistivity and SP logs for shallow interval in TST 423 Sunray No. 10 along with ELAN-derived estimates of clay, sandstone, and fluid volumes
37. Resistivity and SP logs for deep interval in TST 423 Sunray No. 10 along with ELAN-derived estimates of clay, sandstone, and fluid volumes
38. Proposed infill drilling opportunities for oil reservoirs in Red Fish Bay field
Tables
1. Summary of geological, production, engineering, and fluid characteristics of Red Fish Bay field reservoirs considered in this study
2. Recompletion opportunities proposed by this study for currently active wells
Citation
Barnaby, R. J., Ramamoorthy, R., and Holtz, M. H., 1998, Resource Optimization through Geological and Petrophysical Characterization of Downdip Frio Shoreface/Shelf Sandstone Reservoirs: Red Fish Bay Field, South Texas: The University of Texas at Austin, Bureau of Economic Geology, Report of Investigations No. 248, 61 p.
