Reports of Investigations
-
Books & Reports
- Reports of Investigations
- Guidebooks
- Udden Series
- Geological Circulars
- Down To Earth
- Atlases of Major Oil and Gas Reservoirs
- Texas Memorial Museum Publications
- Environmental Geologic Atlas of the Texas Coastal Zone
- Mineral Resource Circulars
- Other Reports
- Seminars and Workshops
- Handbooks
- Submerged Lands of Texas
- Symposia
- Annual Reports
- Open File Reports
-
Maps & Cross Sections
- Thematic Maps
- Miscellaneous Maps, Charts & Sections
- Geologic Atlas of Texas
- STATEMAP Project Maps
- Geologic Quadrangle Maps
- Cross Sections
- Highway Geology Map
- Energy and Mineral Resource Maps
- Shoreline Change and Other Posters
- Wilcox Group, East Texas, Geological / Hydrological Folios
- Bouguer Gravity Atlas of Texas
- River Basin Regional Studies
- Featured Maps
- Posters
- Teachers & the Public
-
Geological Society Publications
- Gulf Coast Association of Geological Societies
- Alabama Geological Society
- Austin Geological Society
- Corpus Christi Geological Society
- Houston Geological Society
- Lafayette Geological Society
- Mississippi Geological Society
- New Orleans Geological Society
- South Texas Geological Society
- GCS SEPM Publications
- Historic BEG & UT Series
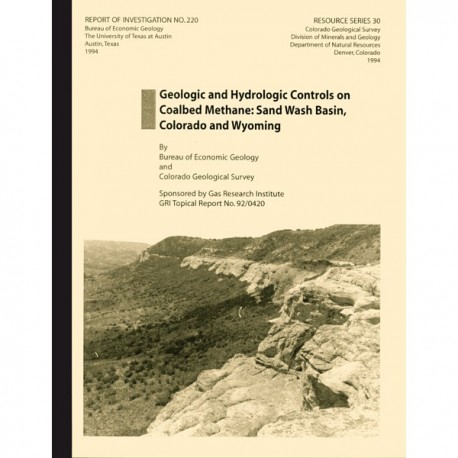
Geologic and Hydrologic Controls on Coalbed Methane: Sand Wash Basin, Colorado and Wyoming
RI0220
For a downloadable, digital version: RI0220D.
RI0220. (with Colorado Geological Survey). Geologic and Hydrologic Controls on Coalbed Methane: Sand Wash Basin, Colorado and Wyoming, by W. R. Kaiser, A. R. Scott, D. S. Hamilton, Roger Tyler, R. G. McMurry, Naijiang Zhou, and C. M. Tremain. 151 p., 85 figs., 9 tables, 1994. Print.
To purchase this publication as a PDF download, please order RI0220D.
Technical Perspective and Results
Coalbed methane production has been established in the Sand Wash Basin. Large coal resources, gas shows during drilling of coal beds, and high gas contents in some coals triggered initial development along the basin margins. Results to date have been disappointing. Coalbed wells have yielded little gas and large volumes of water. In the absence of a regional analysis, neither production data nor the basin's ultimate coalbed methane potential could be fully evaluated. Thus, the need arose for an integrated geologic and hydrologic study of the basin to provide the framework for evaluating development properties and the rationale for future exploration.
Large coal resources occur in the Upper Cretaceous Williams Fork Formation and lower Tertiary Fort Union Formation in the eastern part of the Sand Wash Basin. These coals are mainly subbituminous to high-volatile B bituminous and have average gas contents of less than 200 ft3/ton. (<6.24 m3/t). Coalbed methane resources total 101 Tci (2.86 Tm3) and are 24 Tcf (680 Bm3) at shallow drilling depths of less than 6,000 ft (<1.830 m). More than 87 percent of them are in the Williams Fork. The basin's cumulative gas:water ratio is approximately 15 ft3/bbl (2.7 m3/m3). To date, low gas content and high water production have limited coalbed methane activity in the basin. Steep structural dip and coal distribution have restricted exploration to the eastern margins of the basin. Prospective Williams Fork and Fort Union coals, respectively, lie basinward in association with the Cedar Mountain fault system and westward along Cherokee Arch into the Powder Wash field area. High productivity requires that permeability, ground-water flow direction, coal distribution and rank, gas content, and structural grain be synergistically combined. That synergism explains prolific and marginal production in the San Juan and Sand Wash Basins, respectively. On the basis of a comparison between the basins, a basin-scale coalbed methane producibility model is proposed whose essential elements are: ground-water flow through thick coals of high rank and high gas content orthogonally toward no-flow boundaries and conventional trapping of gas along them.
Keywords: hydrology, coabed methane, Sand Wash Basin, Colorado, Wyoming
CONTENTS
STRUCTURAL AND STRATIGRAPHIC SETTING
TECTONIC EVOLUTION, STRATIGRAPHIC SETTING, AND COAL FRACTURE PATTERNS OF THE SAND WASH BASIN
by Roger Tyler and C. M. Tremain
Abstract
Location
Tectonic Evolution
Stratigraphic Setting
Structural and Stratigraphic Settings of Coal-Bearing Formations
Iles and William Fork Formations
Almond Formation
Lance Formation Fort Union Formation
Wasatch Formation
Green River Formation
Faults, Folds, and Fracture Patterns
Faults and Folds
Fracture Patterns
Cleat Types
Face-Cleat Strikes from Outcrop Observations
Cleat Spacing and Fracture Swarms
Cleat Mineralization
Stress Regime
Conclusions
FIGURES
1. Tectonic map of southwestern Wyoming and adjacent states showing the major tectonic elements of the Greater Green River Basin and the location of the Sand Wash Basin
2. Coal-bearing stratigraphic and confining units in the Sand Wash Basin and surrounding subbasins of the Greater Green River Basin
3. Location of the Sand Wash Basin relative to the Western Interior Seaway
4. Structure map contoured on the base of the Williams Fork Formation, Mesaverde Group, Sand Wash Basin, showing face-cleat trends
5. Structure map contoured on the top of the Williams Fork Formation, Mesaverde Group, Sand Wash Basin, showing face-cleat trends
6. Structure map contoured on the base of the Fort Union Formation, Sand Wash Basin, showing cleat trends
7. Map of tectonic elements in the Sand Wash Basin
8. Structural cross section through the Cedar Mountain fault system, drawn on the Mesaverde Group, Sand Wash Basin
9. Stress province map showing major stress province boundaries in the vicinity of the Sand Wash Basin
TABLES
1. Coal mine faults in the Sand Wash Basin
2. Cleat and fracture observations in the Sand Wash Basin
3. Cleat mineralization in the Sand Wash Basin
UPPER CRETACEOUS MESAVERDE GROUP
STRATIGRAPHY AND COAL OCCURRENCE OF THE UPPER CRETACEOUS MESAVERDE GROUP, SAND WASH BASIN
by Douglas S. Hamilton
Abstract
Introduction
Genetic Approach to Stratigraphic Analysis
Genetic Stratigraphy of the Upper Mesaverde Group
Comparison with Traditional Stratigraphy
Coal Occurrence of the Upper Mesaverde Group
Coal Identification
Coal Seam Continuity
Williams Fork Genetic Depositional Sequences
Unit 1
Depositional Systems
Coal Stratigraphy
Coal Distribution
Geological Controls on Coal Seam Occurrence
Unit 2
Depositional Systems
Coal Stratigraphy
Coal Distribution
Geological Controls on Coal Seam Occurrence
Unit 3
Depositional Systems
Coal Stratigraphy
Coal Distribution
Geologic Controls on Coal Seam Occurrence
Unit 4
Depositional Systems
Coal Stratigraphy
Coal Distribution
Geologic Controls on Coal Seam Occurrence
Almond Genetic Depositional Sequence
Depositional Systems
Coal Stratigraphy and Distribution
Geologic Controls on Coal Seam Occurrence
Conclusions
FIGURES
10. Stratigraphy of the Sand Wash Basin
11. Genetic stratigraphy of the upper Mesaverde Group in the eastern Sand Wash Basin
12. Northwest-southeast cross section of the upper Mesaverde Group, Sand Wash Basin, illustrating genetic stratigraphy of the Williams Fork Formation and coal occurrence
13. North-south cross section of the upper Mesaverde Group, eastern Sand Wash Basin
14. Density profile of typical Williams Fork coals
15. Net-sandstone map of Unit 1,Williams Fork Formation
16. Net-coal-thickness map of Unit 1, Williams Fork Formation
17. Net-sandstone map of Unit 2, Williams Fork Formation
18. Isopach of the Unit 2 coal seam
19. Net-coal-thickness map of Unit 2, Williams Fork Formation
20. Cross section of the Unit 2 coal
21. Percent-sandstone map of Unit 3, Williams Fork Formation
22. Net-coal-thickness map of Unit 3,Williams Fork Formation
23. Percent-sandstone map of Unit 4, Williams Fork Formation
24. Net-coal-thickness map of Unit 4, Williams Fork Formation
25. Percent-sandstone map of the Almond Formation
26. Net-coal-thickness map of the Almond Formation
COAL RANK, GAS CONTENT, AND COMPOSITION AND ORIGIN OF COALBED GASES, MESAVERDE GROUP, SAND WASH BASIN
by Andrew R. Scott
Abstract
Thermal Maturity
Gas Content
Sorption Isotherms
Gas Composition
Origin of Coalbed Gases
Conclusions
FIGURES
27. Correlation between vitrinite reflectance and coal Btu
28. Vitrinite reflectance profiles for the Sand Wash Basin
29. Vitrinite reflectance profiles using depth versus vitrinite reflectance for Mesaverde coals in the Sand Wash Basin
30. Mesaverde coal rank map
31. Histogram of ash-free Mesaverde gas contents
32. Gas content profile for the Sand Wash Basin Mesaverde coals
33. Relation between gas contents determined at room (STP conditions) and reservoir temperatures
34. West-east cross section showing the changes in gas content and gas composition between different Mesaverde coal beds 35. Adsorption isotherms for Mesaverde coalbed gases
36. Composition of Mesaverde coal bed gases
37. Variation of carbon dioxide content with gas dryness index (C1/C1-5) values
HYDROLOGIC SETTING OF THE UPPER MESAVERDE GROUP. SAND WASH BASIN
by Andrew R. Scott and W. R. Kaiser
Abstract
Introduction
Hydrostratigraphy
Hydrodynamics
Potentiometric Surface
Pressure Regime
Hydrochemistry
Regional Flow
Conclusions
FIGURES
38. Depth versus pressure plot for Mesaverde DST data from the Sand Wash Basin
39. Location of study areas, Mesaverde head data, and coalbed methane fields
40. Upper Mesaverde potentiometric-surface map
41. Mean annual precipitation, topography, and major drainage in the Sand Wash Basin
42. Mesaverde pressure-elevation plots for pressure analysis, Areas 2, 3, and 6
43. Structural-contour map of the top of the Williams Fork Formation in the Sand Wash and Washakie Basins
44. Southwest-northeast cross section across the geopressured-hydropressured,transition zone
45. West-east cross section through Washakie Basin
46. Mesaverde chlorinity map
47. Mesaverde total dissolved solids map
PALEOCENE FORT UNION FORMATION
STRATIGRAPHY AND COAL OCCURRENCE OF THE PALEOCENE FORT UNION FORMATION, SAND WASH BASIN
by Roger Tyler and R. C. McMurry
Abstract
Introduction
Lithostratigraphic Zones and Units
Fox Hills Sandstone
Lance Formation
Massive Cretaceous and Tertiary (W) Sandstone Unit
Fort Union Formation
Wasatch Formation
Sandstone and Coal Occurrence of the Fort Union Formation
Lower Coal-Bearing Unit
Gray-Green Mudstone Unit
Basin Sandy Unit
Upper Shaly Unit
Geologic Controls on the Occurrence of Paleocene Fort Union Formation Coal Beds, Sand Wash Basin
Syntectonic Controls on Upper Cretaceous and Early Tertiary Sedimentation
Conclusions
FIGURES
48. Type log and stratigraphic nomenclature of the Paleocene Fort Union Formation, Sand Wash Basin. and the occurrence of coal
49. Northwest-southeast stratigraphic cross section A-A' of the Paleocene Fort Union Formation, Sand Wash Basin, illustrating operationally defined stratigraphic units and coal occurrence
50. West-east stratigraphic cross section B-B' through TI 2N of the Paleocene Fort Union Formation, Sand Wash Basin, illustrating operationally defined stratigraphic units and coal occurrence of the lower coal-bearing unit
51. West-east stratigraphic cross section C-C' through T1ON of the Paleocene Fort Union Formation, Sand Wash Basin, illustrating operationally defined stratigraphic units and coal occurrence of the lower coal-bearing unit
52. Location of stratigraphic cross sections A-A' to E-E' (figs. 49, 50, 51, 57, and 58) in the Paleocene Fort Union Formation, Sand Wash Basin
53. Net-sandstone-thickness map of the massive CretaceousiTertiary (Kill sandstone unit, Sand Wash Basin
54. Net-sandstone-thickness map of the lower coal-bearing unit, Fort Union Formation, Sand Wash Basin
55. Net-sandstone percentage map of the lower coal-bearing unit, Fort Union Formation, Sand Wash Basin
56. Maximum-sandstone-thickness map of the lower coal-bearing unit, Fort Union Formation, Sand Wash Basin
57. Detailed west-east stratigraphic cross section D-D' through TI 2N of the lower coal-bearing unit, Paleocene Fort Union Formation, Sand Wash Basin, illustrating occurrence of coal packages 1 and 2
58. Detailed north-south stratigraphic cross section E-E' between R92W and R93W of the lower coal-bearing unit, Paleocene Fort Union Formation, Sand Wash Basin, illustrating occurrence of coal packages 1 and 2
59. Maximum-coal-thickness map of the lower coal-bearing unit. Fort Union Formation. Sand Wash Basin
60. Net-coal-thickness map of the lower coal-bearing unit, Fort Union Formation, Sand Wash Basin
61. Coal-isopleth map of the lower coal-bearing unit, Fort Union Formation, Sand Wash Basin
62. Net-mudstone-thickness map of the gray-green mudstone unit, Fort Union Formation, Sand Wash Basin
63. Net-sandstone-thickness map of the basin sandy unit, Fort Union Formation, Sand Wash Basin
64. Block diagrams showing the stratigraphic development of the Fort Union Formation, Sand Wash Basin
COAL RANK, GAS CONTENT, AND COMPOSITION AND ORIGIN OF COALBED GASES, FORT UNION FORMATION, SAND WASH BASIN
by Andrew R. Scott
Abstract
Thermal Maturity and Gas Content
Coal Rank
Gas Content
Gas Composition
Origin of Coalbed Gases
Conclusions
FIGURES
65. Fort Union vitrinite reflectance profiles relative to elevation and depth
66. Coal rank map for the base of the Fort Union
67. Histogram of gas content values for Fort Union coal samples
68. Gas content profiles for Fort Union coals
69. Adsorption isotherms for Fort Union coal samples
70. Gas content determined at room and reservoir temperatures
HYDROLOGIC SETTING OF THE FORT UNION FORMATION. SAND WASH BASIN
by Andrew R. Scott and W. R. Kaiser
Abstract
Introduction
Hydrostratigraphy
Hydrodynamics
Potentiometric Surface
Pressure Regime
Hydrochemistry
Regional Flow
Conclusions
FIGURES
71. Pressure-depth plot for Fort Union DST data, Sand Wash Basin
72. Fort Union pressure-analysis areas and DST well locations
73. Equivalent fresh-water heads and pressure gradients in the lower coal-bearing unit, Fort Union Formation
74. Fort Union pressure-elevation plots for four pressure-analysis areas
75. Distribution of vertical pressure gradients by well, Fort Union Formation
76. West-east hydrochemical cross section, Sand Wash Basin
77. Equivalent fresh-water heads and pressure gradients in the upper shaly unit, Fort Union Formation
RESOURCES AND PRODUCTION
RESOURCES AND PRODUClBlLlTY OF COALBED METHANE IN THE SAND WASH BASIN
by W. R. Kaiser, Andrew R. Scott, Naijiang Zhou, Douglas S. Hamilton, and Roger Tyler
Abstract
Introduction
Resources
Production
Controls on Production
Producibility
Conclusions
FIGURES
78. Gas content profiles and equations used for in-place gas and coal resource calculations
79. Initial water potentials, Williams Fork and Fort Union coals
80. Geologic and hydrologic characterization of the Williams Fork Formation
81. Geologic and hydrologic characterization of the Fort Union Formation
82. Interplay of geologic and hydrologic controls
83. Key geologic and hydrologic controls
84. Geologic and hydrologic comparison of the San Juan and Sand Wash Basins
85. Schematic cross-sectional ground-water flow,San Juan Basin
TABLES
4. Coalbed methane resources of the Sand Wash Basin
5. Coal resources of the Sand Wash Basin
6. Coalbed methane resources in the Williams Fork Formation
7. Coal resources in the Williams Fork Formation
8. Cumulative gas and water production
9. Coal and gas resources in the Sand Wash Basin based on depth to the base of the coal-bearing unit
ACKNOWLEDGMENTS
REFERENCES
Citation
Kaiser, W. R., Scott, A. R., Hamilton, D. S., Tyler, Roger, McMurry, R. G., Zhou, N., and Tremain, C. M., 1994, Geologic and Hydrologic Controls on Coalbed Methane: Sand Wash Basin, Colorado and Wyoming: The University of Texas at Austin, Bureau of Economic Geology, Report of Investigations No. 220, 151 p.
