Reports of Investigations
-
Books & Reports
- Reports of Investigations
- Guidebooks
- Udden Series
- Geological Circulars
- Down To Earth
- Atlases of Major Oil and Gas Reservoirs
- Texas Memorial Museum Publications
- Environmental Geologic Atlas of the Texas Coastal Zone
- Mineral Resource Circulars
- Other Reports
- Seminars and Workshops
- Handbooks
- Submerged Lands of Texas
- Symposia
- Annual Reports
- Open File Reports
-
Maps & Cross Sections
- Thematic Maps
- Miscellaneous Maps, Charts & Sections
- Geologic Atlas of Texas
- STATEMAP Project Maps
- Geologic Quadrangle Maps
- Cross Sections
- Highway Geology Map
- Energy and Mineral Resource Maps
- Shoreline Change and Other Posters
- Wilcox Group, East Texas, Geological / Hydrological Folios
- Bouguer Gravity Atlas of Texas
- River Basin Regional Studies
- Featured Maps
- Posters
- Teachers & the Public
-
Geological Society Publications
- Gulf Coast Association of Geological Societies
- Alabama Geological Society
- Austin Geological Society
- Corpus Christi Geological Society
- Houston Geological Society
- Lafayette Geological Society
- Mississippi Geological Society
- New Orleans Geological Society
- South Texas Geological Society
- GCS SEPM Publications
- Historic BEG & UT Series
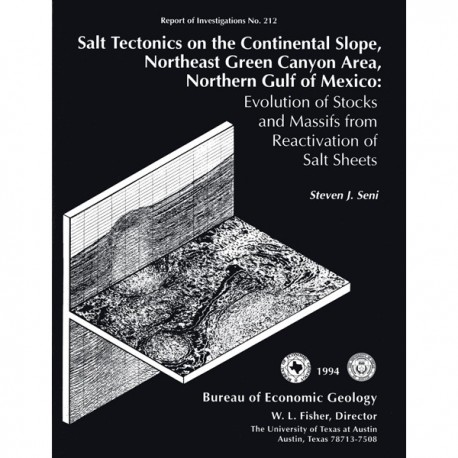
Salt Tectonics on the Continental Slope, Northeast Green Canyon Area, Northern Gulf of Mexico: Evolution of Stocks
RI0212
For a downloadable, digital version: RI0212D.
RI0212. Salt Tectonics on the Continental Slope, Northeast Green Canyon Area, Northern Gulf of Mexico: Evolution of Stocks and Massifs from Reactivation of Salt Sheets, by S. J. Seni. 102 p., 59 figs., 4 tables, 1994. Print.
To purchase this publication as a downloadable PDF, please order RI0212D.
ABSTRACT
Data from conventional two- and three-dimensional seismic surveys and wells were used to analyze the morphology of salt structures and to determine the history of salt emplacement in a 1,500-mi2 (3,885-km2) region of the continental slope, northeast Green Canyon Area. Salt structures within the region include stocks, massifs, an allochthonous sheet, and remnant-salt structures. Also within this region is a largely salt free area (at least to a depth of 20,000 to 25,000 ft (6,100 to 7,600 m) that coincides with a U-shaped submarine trough. A large graben between an east-northeast-trending zone of growth faults near the shelf margin and a parallel trend of counterregional growth faults located 30 to 40 mi (48 to 64 km) basinward contains the submarine trough, stocks, and massifs. This graben is inferred to have formed from extension and subsidence as burial of the landward portion of a thick salt sheet produced massifs and stocks by downbuilding. Large-displacement counterregional growth faults form the northern, landward margin of a large salt sheet that extends to the Sigsbee Escarpment.
Differential loading separates salt stocks and massifs from the trailing margin of a salt sheet. During sheet burial, the landward margin of the sheet is segmented into discrete, irregular massifs separated by salt-withdrawal basins. These massifs are in turn segmented into stocks. The early stage of salt structural evolution of stocks and massifs is similar. The deeply buried margins of stocks, massifs, and remnant-salt structures are geometrically and structurally analogous to salt rollers, indicating a common pattern of structural evolution. This structural pattern includes initial growth under thin cover in an extensional regime. Strata thin over the crest and onlap the flanks of the structures. Thickness variations indicate syndepositional salt structural evolution under thin (<1,000 ft [<300 m]) cover.
The former presence of salt below the submarine trough is inferred on the basis of remnant-salt structures and a turtle-structure anticline lying on a discontinuity. Where salt is absent, this discontinuity is a salt weld representing suturing of sediments formerly separated by a salt sheet. Age of sediments below the weld indicates that sheet extrusion occurred in late Miocene to early Pliocene (4.6 to 5.3 m.y.a.). The age of sediments above the weld is late Pliocene (2.8 to 3.5 m.y.a.). In the submarine trough, sheet burial began in the late Pliocene and around the massifs burial continued from the early Pleistocene to the Holocene.
Keywords: differential loading, Gulf of Mexico slope, massifs, salt weld, sheet evolution, stocks, turtle structure
CONTENTS
Abstract
Introduction
Objectives
Setting
Salt Morphology
Development of Salt Structures
Methods
Seismic Data
Well Data
Mapping Methods
Quantitative
Geometry and Distribution of Salt Structures
Salt Provinces
Salt-Controlled Bathymetry
Salt Distribution in the Detailed Region
Stocks
Massifs
Sheets
Minor Salt Structures
Remnant-salt structures
Peripheral tongue
Depositional and Postdepositional Features
Salt-Withdrawal Basins Submarine Trough
Submarine-trough structure
Strata and structure near stocks
Submarine-trough strata
Structural inversion
Origin of the submarine trough
Faults
Regional fault patterns
Regional growth faults
Massif- and sheet-flank faults
Evolution of Salt Structures on the Slope
Quantitative Stock Evolution
Palinspastic reconstruction
R'/A' growth curves
Quantitative Massif Evolution
Palinspastic reconstruction
R'/A' growth curves
Quantitative Sheet Evolution
Palinspastic reconstruction
R'/A' growth curves
Qualitative Evolution
Conceptual Model of Salt-Sheet Burial
Integrated Evolution of Salt Structures
Discussion
Associations of Salt Structures
Mechanisms of Salt Movement on the Slope
Evolution of Stocks and Massifs by Sheet Burial
Salt-Sheet Removal
Figures
1. Location map showing Gulf of Mexico, inland salt diapir provinces, and salt structures
2. Schematic view of types of salt structures
3. Stages of evolution of salt structures during progradation of the northern Gulf of Mexico slope
4. Regional map showing distribution of area boundaries, seismic lines, and well control
5. Stratigraphic chart and mapped horizons and correlations with paleontologic zones and eustatic sea-level curves
6. Graph of conversion function for time to depth
7. Seismic line G illustrating correlation horizons, paleontologic horizons, and well log
8. Palinspastic reconstructions using backstripping and decompaction
9. Schematic vertical sections illustrating dome-growth processes
10. Map of major salt structures, basins, and regional faults, northeast Green Canyon Area
11. Map of bathymetry, faults at the seafloor, and shallow salt structures in the detailed region
12. Map of canyons on shelf and projected connection with submarine trough
13. Seiscrop map at 2.8 s of the detailed region
14. Map of time-structure contours of top of salt in the detailed region
15. Isometric block diagram of time-structure contours of salt in the detailed region
16. Map of salt-structure contours of part of the detailed region showing distribution of remnant-salt structures in the submarine trough
17. Seismic line H showing structure and geometry of stocks 2 and 3
18. Isometric block diagram of stocks, northeast Green Canyon Area
19. Seismic line I illustrating geometry of stock 1
20. Isometric block diagram of massifs 2 and 3, northeast Green Canyon Area
21. Seismic line J illustrating massifs 2 and 3
22. Seiscrop maps at 1.8 to 3.8 s showing variations in geometry of massif 3
23. Seismic line B illustrating regionally extensive sheet of salt
24. Interpreted seismic lines C, 0, E, and F of salt sheet
25. Map of top of salt sheet from south of the detailed region to Sigsbee Escarpment
26. Isometric block diagrams of salt sheet extending south of the detailed region to Sigsbee Escarpment
27. Map of bathymetry over salt sheet south of the detailed region to Sigsbee Escarpment
28. Seiscrop map at 4.3 s showing features associated with updip termination of sheet
29. Seismic line G showing geometry of remnant-salt structures in submarine trough
30. Parallel seismic lines K, L, J, and M showing slices through a peripheral tongue
31. Map of synclinal axial traces and location of structural lows of salt-withdrawal basins associated with salt massifs
32. Map of synclinal axial traces and location of structural lows of basins within the submarine trough
33. Seiscrop maps at 2.8 and 4.3 s showing orientation of axial traces
34. Seismic line I and seiscrop map at 2.8 s showing geometry of stock 1 and structure of surrounding strata
35. lsopach map of Pleistocene and Holocene fill in the detailed region
36. Seismic line N illustrating sediment-cored anticline between massifs 1 and 2
37. Time-structure and time-isopach maps illustrating geometry of Pliocene(?) sediment-cored anticline
38. Reconstruction of sediment-cored anticline showing structural reversal
39. Intersecting seismic lines G and N showing a turtle structure and remnant-salt structures overlying the same horizon
40. Maps of time-structure contours, faults, and salt structures in the detailed region
41. Seiscrop maps of strata I patterns at bases of basins 1 and 2
42. Seismic lines A and G showing regional growth-fault geometry
43. Seismic lines G, 0, and P showing possible thrust-fault geometry
44. Graph of growth index of regional growth fault
45. Parallel seismic lines Q-U showing transfer zone across a counterregional fault along northern margin of massif 2
46. Seismic line V illustrating a normal fault and associated graben on landward margin of massif 3
47. Map of peripheral sink basins in submarine trough superimposed on bathymetric map
48. Graph of volume of peripheral sink basins
49. Depth-converted and decompacted palinspastic reconstruction of seismic line 1
50. Incremental R'/A' growth curve of stocks 1, 2, and 3
51. Graph of volume of withdrawal basins 2, 3, and 4
52. Palinspastic reconstruction of seismic line R showing evolution of massif 2
53. R'/A' growth curve of massifs 2 and 3
54. Palinspastic reconstruction of seismic line B illustrating evolution of salt sheet
55. R'/A' growth curve of salt sheet
56. Dip-oriented seismic lines I, M, and R showing assemblage of salt structures
57. Strike-oriented seismic lines V, J, and W showing assemblage of salt structures
58. Conceptual model showing reactivation of salt sheet and table of original model parameters
59. Schematic dip-oriented section integrating evolution of salt structures and majorfeatures in the detailed region
Tables
1. Geometric characteristics of salt stocks in the detailed region
2. Geometric characteristics of salt massifs in the detailed region
3. Geometric characteristics of salt sheets in the detailed region and Sigsbee Escarpment
4. Geometric characteristics of faults in the detailed region
Citation
Seni, S. J., 1994, Salt Tectonics on the Continental Slope, Northeast Green Canyon Area, Northern Gulf of Mexico: Evolution of Stocks and Massifs from Reactivation of Salt Sheets: The University of Texas at Austin, Bureau of Economic Geology, Report of Investigations No. 212, 102 p.
