Reports of Investigations
-
Books & Reports
- Reports of Investigations
- Guidebooks
- Udden Series
- Geological Circulars
- Down To Earth
- Atlases of Major Oil and Gas Reservoirs
- Texas Memorial Museum Publications
- Environmental Geologic Atlas of the Texas Coastal Zone
- Mineral Resource Circulars
- Other Reports
- Seminars and Workshops
- Handbooks
- Submerged Lands of Texas
- Symposia
- Annual Reports
- Open File Reports
-
Maps & Cross Sections
- Thematic Maps
- Miscellaneous Maps, Charts & Sections
- Geologic Atlas of Texas
- STATEMAP Project Maps
- Geologic Quadrangle Maps
- Cross Sections
- Highway Geology Map
- Energy and Mineral Resource Maps
- Shoreline Change and Other Posters
- Wilcox Group, East Texas, Geological / Hydrological Folios
- Bouguer Gravity Atlas of Texas
- River Basin Regional Studies
- Featured Maps
- Posters
- Teachers & the Public
-
Geological Society Publications
- Gulf Coast Association of Geological Societies
- Alabama Geological Society
- Austin Geological Society
- Corpus Christi Geological Society
- Houston Geological Society
- Lafayette Geological Society
- Mississippi Geological Society
- New Orleans Geological Society
- South Texas Geological Society
- GCS SEPM Publications
- Historic BEG & UT Series
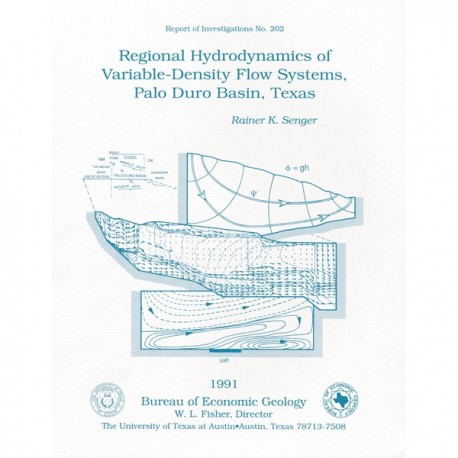
RI0202. Regional Hydrodynamics of Variable-Density Flow Systems, Palo Duro Basin Texas, by R. K. Senger. 54 p., 30 figs., 4 tables, 1991. Print.
To purchase this publication as a downloadable PDF, please order RI0202D.
ABSTRACT
In mature sedimentary basins, where mechanical compaction is negligible, the hydrodynamics is typically described by steady-state flow driven by potential energy represented by the water table, which generally follows the topography. In regional flow systems consisting of both shallow fresh-water aquifers and deep saline aquifers, however, ground-water flow can be greatly affected where buoyancy forces associated with high salinities dominate the flow component caused· by topographic relief.
Effects of significant fluid-density variation on regional ground-water flow through the Palo Duro Basin. Texas, where densities are between 1.0 and 1.15 g/cm3, were studied using a regional cross-sectional model. Steady-state flow of variable-density ground water was simulated by computation of equivalent fresh-water heads and stream functions incorporating fluid densities that vary in space but are assumed tobe time invariant. Modeling indicates that overall ground-water circulation in the basin is not significantly affected by regional fluid-density variations, except near the discharge boundary, where high fluid densities cause increased downward flow. However, simulated equivalent fresh-water heads differ from those obtained assuming fresh-water density, which is important for model calibration. The hydrodynamics associated with the present topography is characterized by relatively steep hydraulic gradients across the basin, thereby dominating potential buoyancy-flow phenomena.
The relation between the two driving forces, buoyancy associated with variable-density ground water and the head gradient arising from topographic relief, was studied using a generic flow and solute-transport scenario in the context of basin hydrology affected by uplift, deposition, or erosion. Results from the flow and solute-transport simulations indicate that the dissolved mass, represented by high-density fluids, responds to changes in hydrologic boundary conditions over a much longer time than do fluid pressures, thus changing the relative magnitude of the two driving forces. Considering the hydrodynamic changes associated with Cenozoic basin uplift, deposition, and erosion, the observed salinity distribution in the Palo Duro Basin may represent some past state of the hydrodynamic system. Paleohydrologic modeling indicates that before maximum basin uplift, when the topographically induced hydraulic gradient across the basin was smaller than at present, buoyancy-dominated flow patterns occurred, characterized by a continuous overturn of fluids, which restrict recharge to the upper part of the deep aquifers. With continued uplift, buoyancy-dominated flow phenomena diminish, and the flow component arising from topographic relief becomes more important. The presence of biodegraded hydrocarbons in the Triassic Dockum Group overlying the evaporite confining unit in eastern New Mexico can be related to secondary migration of hydrocarbons associated with the paleoflow system that existed before Pecos River valley erosion, when basin uplift was most advanced.
Keywords: basin hydrodynamics, numerical modeling, paleohydrology, Permian Basin, variable-density flow
CONTENTS
Abstract
Introduction
Hydrogeology of the Palo Duro Basin
Geologic Setting
Physiography and Climate
Geologic Processes
Cenozoic tectonic events
Geomorphic events
Hydrocarbon occurrence
Hydrostratigraphy
Hydraulic-Head Distributions
Recharge and Discharge
Variable-Density Flow Modeling Approach
Background
Theory of Variable-Density Flow
Evaluation of Driving Forces of Variable-Density Flow
Variable-Density Flow Simulation. Palo Duro Basin
Simulation Approach
Fluid properties
Boundary conditions
Limitations of the Model
Mode ling Results
Uniform fluid density
Variable fluiddensity
Discussion
Comparison of simulation results
Evaluation of observed data
Implications to modeling strategy
Effects of Transient Flow and Solute Transport
Non-Steady-State Solute Distribution
Changes in Hydraulic Boundary Conditions
Continuous solute source
Discontinuous solute source
Implications to Regional Flow and Solute Transport
Paleohydrologic Modeling of Variable-Density Flow,Palo Duro Basin
Simulation Strategy
Limitations of the Model
Modeling Results
Preuplift conditions
Basin uplift and tilting
Ogallala deposition
Pecos River valley erosion
Retreat of the Caprock Escarpment
Discussion
Buoyancy-dominated flow patterns
Hydrodynamics of secondary hydrocarbon migration
Implications to basin hydrochemistry
Summary
Acknowledgments
References
Figures
1. Schematic diagram of gravity-driven flow, the primary driving mechanism in a mature sedimentary basin
2. Location and structural features of the Texas Panhandle and adjacent areas
3. Regional west-east cross section schematically illustrating the spatial relationships of major depositional systems in the Palo Duro Basin
4. Generalized stratigraphic column of the Palo Duro Basin and adjacent areas
5. Regional topography of the Texas Panhandle and adjacent areas
6. Average equivalent fresh-water head distribution of the entire Deep-Basin Brine aquifer constructed from kriged estimates of fresh-water hydraulic head
7. Contours of equivalent fresh-water head, fluid density, and stream functions of an isotropic, homogeneous aquifer
8. Distribution of flow velocities and ·fluid densities of the seawater intrusion problem, representing approximate steady-state conditions
9. Distribution of equivalent fresh -water heads, stream functions, and flow velocities based on FRSURF /VDF and FRESTR/VDF
10. Finite-element mesh representing the major hydrologic units along the west-east geologic cross section
11. Distribution of fluid densities calculated from limited data on salinity and from temperature distributions based on linear geothermal gradients along the cross-sectional traverse
12. Distribution of fluid viscosities calculated from schematic salinity temperature distributions based on linear geothermal gradients along the cross-sectional traverse
13. Pressure-depth data from the deep brine aquifers (Pennsylvanian and pre-Pennsylvanian strata), Jackson County, Oklahoma
14. Flow net from initial simulation V-1 using uniform fluid density and viscosity of shallow ground water throughout the entire cross-section area
15. Distribution of equivalent fresh-water heads and computed element fluxes from simulation V-1
16. Distribution of streamline contours and computed element fluxes from simulation V-2
17. Equivalent fresh-water head versus depth calculated from fluid pressure measurements from the Deep-Basin Brine aquifer in the DOE J. Friemel No. 1 and Mansfield No. 1 wells and "class A" pressure data from Oldham County
18. Equivalent fresh-water head versus depth calculated from fluid pressure measurements from the Deep-Basin Brine aquifer in the DOE Zeeck No. 1 and Sawyer No. 1 wells and "class A" pressure data from various counties
19. Distribution of equivalent fresh-water heads and computed element fluxes from simulation V-3, where granite-wash permeability was increased and uniform head values were prescribed along the right-hand boundary
20. Results of transient flow and transport in simulation S-2, using SUTRA, illustrating seawater intrusion with reduced recharge rate of fresh water along the left-hand boundary
21. Steady-state distribution of equivalent fresh-water heads and flow vectors of simulation S-2 using FRSURF/VDF
22. Results of transient flow and transport using SUTRA of simulation S-3
23. Flow pattern and equivalent fresh-water heads of simulation S-3 simulated with FRSURF/VDF
24. Results of transient flow and transport analogous to simulation S-3 using SUTRA
25. Computed flow pattern and fluid density for simulation S-4, using SUTRA
26. Distribution of equivalent fresh-water heads and computed element fluxes from simulation VT-1, representing preuplift hydrodynamic conditions
27. Distribution of stream functions and computed element fluxes from simulation VT-1
28. Distribution of equivalent fresh-water heads, stream functions, and flow velocities from simulation VT-2
29. Distribution of equivalent fresh-water head, stream functions, and flow velocities from simulation VT-3, representing steady-state flow of variable density before Pecos River valley erosion
30. Distribution of equivalent fresh-water heads, stream functions, and computed element fluxes, from simulation VT-4, representing hydrodynamic conditions after Pecos River valley erosion
31. Results of coupled flow and transport solution associated with salt transport from a salt dome at the base of the model and a flow system established by an imposed pressure gradient at the upper surface
Tables
1. Assigned permeability values for the major hydrostratigraphic units of the model
2. Summary of numerical simulations using the seawater intrusion scenario
3. Summary of paleohydrologic simulations
Citation
Senger, R. K., 1991, Regional Hydrodynamics of Variable-Density Flow Systems, Palo Duro Basin Texas: The University of Texas at Austin, Bureau of Economic Geology, Report of Investigations No. 202, 54 p.
:
