Reports of Investigations
-
Books & Reports
- Reports of Investigations
- Guidebooks
- Udden Series
- Geological Circulars
- Down To Earth
- Atlases of Major Oil and Gas Reservoirs
- Texas Memorial Museum Publications
- Environmental Geologic Atlas of the Texas Coastal Zone
- Mineral Resource Circulars
- Other Reports
- Seminars and Workshops
- Handbooks
- Submerged Lands of Texas
- Symposia
- Annual Reports
- Open File Reports
-
Maps & Cross Sections
- Thematic Maps
- Miscellaneous Maps, Charts & Sections
- Geologic Atlas of Texas
- STATEMAP Project Maps
- Geologic Quadrangle Maps
- Cross Sections
- Highway Geology Map
- Energy and Mineral Resource Maps
- Shoreline Change and Other Posters
- Wilcox Group, East Texas, Geological / Hydrological Folios
- Bouguer Gravity Atlas of Texas
- River Basin Regional Studies
- Featured Maps
- Posters
- Teachers & the Public
-
Geological Society Publications
- Gulf Coast Association of Geological Societies
- Alabama Geological Society
- Austin Geological Society
- Corpus Christi Geological Society
- Houston Geological Society
- Lafayette Geological Society
- Mississippi Geological Society
- New Orleans Geological Society
- South Texas Geological Society
- GCS SEPM Publications
- Historic BEG & UT Series
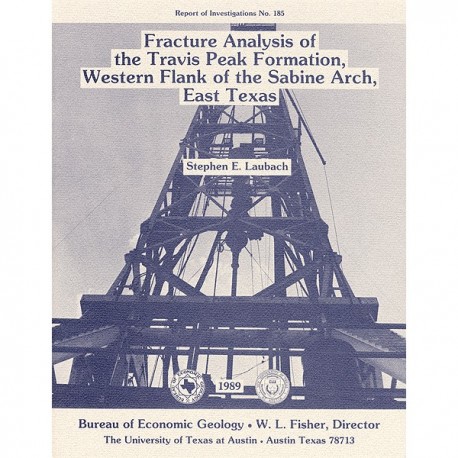
Fracture Analysis of the Travis Peak Formation, Western Flank of the Sabine Arch, East Texas
RI0185
For a downloadable, digital version: RI0185D.
RI0185. Fracture Analysis of the Travis Peak Formation, Western Flank of the Sabine Arch, East Texas, by S. E. Laubach. 55 p., 41 figs., 6 tables, 1989. ISSN: 0082335X: Print.
To purchase this publication as a downloadable PDF, please order RI0185D.
ABSTRACT
Successful development of low-permeability-sandstone gas reservoirs depends on an understanding
of their natural fracture patterns and on predictions of the orientation of horizontal stresses.
This report describes the preliminary results of fracture analysis of the Lower Cretaceous Travis
Peak Formation, a tabular sandstone and shale unit approximately 2,000 ft (610 m) thick that
produces gas from low-permeability (less than 1 md) sandstone in much of East Texas. Depth to the
top of the formation ranges between 5,900 and 9,500 ft (1,798 and 2,895 m) in the study area. The
study is based on analysis of 565 natural and coring-induced fractures in more than 2,100 ft (640 m) of
whole core from 8 wells in the Travis Peak Formation, together with borehole televiewer and other
fracture-imaging logs from 3 wells. Natural fractures in the formation strike east-northeast to
northeast and provide potential natural conduits and reservoirs for gas. Quartz cementation and
fracture formation were contemporaneous. Microstructures within fracture-filling quartz indicate that
extension fractures in sandstone result from natural hydraulic fracturing. The study also indicates
that healed microfractures are useful for mapping fracture trends and that the orientation of coring-induced
fractures can be used to infer stress directions and the propagation direction of fractures
created in hydraulic fracture treatment. The model of natural fracture development predicts that
fractures are most abundant in rocks with the most quartz cement. Natural fractures deserve careful
consideration in the design of hydraulic fracture treatment for reservoir stimulation.
Correlation of the sequence of vein-mineral precipitation with diagenetic history suggests that
natural extension fractures in sandstone propagated at depths of between 3,000 and 5,000 ft (914 and
1,524 m) during the migration of quartz-precipitating fluids. Previous 6180 studies of quartz cement in
the Travis Peak suggest that the fluids may have been deeply circulating meteoric water. Fracture
permeability, which is indicated by results of this study, provides a mechanism for the passage of large
fluid volumes recorded by extensive precipitation of quartz cement. Quartz precipitation lowers
permeability and restricts fluid flow, thus raising fluid pressure, resulting in intermittent fracturing and
sealing ("crack-seal" deformation). Fractures stopped propagating before maximum burial depth was
achieved. One characteristic of Travis Peak sandstone is preservation of open fractures with widths
of as much as 0.2 inch (5 mm) to depths of as much as 9,950 ft (3,032 m) in rocks that currently have
near-hydrostatic fluid pressures.
East-northeast-trending coring-induced petal-centerline fractures are parallel both to fractures
created in hydraulic fracture treatments and open-hole hydraulic stress tests and to the direction of
maximum horizontal strain recovery measured with anelastic strain recovery experiments. Coring-induced
fractures are therefore useful indicators of horizontal stress trajectories in this area. The
average strike of natural fractures is close to the average strike of coring-induced fractures, but
natural and coring-induced fractures are commonly not parallel. This indicates that stimulation
fractures may not propagate exactly parallel to natural fractures in the Travis Peak Formation.
Keywords: East Texas, hydrocarbon resources, natural and artificially induced fractures, stress, tight gas sandstone, Travis Peak Formation
CONTENTS
Abstract
Introduction
Geologic Setting
Fracture
Natural Fractures
Sandstone Fractures
Fracture Attitude
Fracture Shape
Fracture Intensity
Open Fractures
Petrology of Fracture-Filling Minerals
Sequence of Mineral Precipitation
Microstructures in Fracture-Filling Minerals
Microfractures
Healed Microfractures
Open Transgranular Microfractures
Grain-Boundary Microcracks
Regional Contrasts
Mudstone Fractures
Physical Characteristics
Timing of Mudstone Fracture Formation
Interpretation of Mudstone Fractures
Coring-Induced Fractures
Petal and Petal-Centerline Fractures
Petal and Petal-Centerline Orientation
Stress Direction Indicators
Strain Measurements on Core
Borehole Breakouts Fractures Created in Stress Tests
Fractures Created in Hydraulic Fracture Treatments
Coring-Induced Fractures: Summary
Discussion
Fracture Timing
Fracture Mechanism
Natural Hydraulic Fractures Role of Tectonism
Unloading and Thermoelastic
Termination of Fracturing
Implications for Stress-History Models
Origin and Significance of Healed Microfractures
Coring-Induced Fractures and Stress Directions
Implications of Natural Fractures for Hydraulic Fracture Treatment
Conclusions
Acknowledgments
References
Figures
1. Location of study area and wells
2. Attitudes of natural extension fractures in the Travis Peak Formation, East Texas
3. Fracture attitudes and heights from borehole televiewer and Formation Microscanner logs
4. Histograms of natural microfracture strikes in Howell No. 5
5. Four views of a natural open fracture, Holditch SFE No. 2
6. Graph of natural and coring-induced fracture height versus depth
7. Graph of natural and coring-induced fracture height versus depth below the top of the Travis Peak Formation
8. Shapes of natural fractures in the Travis Peak Formation
9. Diagram of fracture cross section illustrating fracture along grain boundaries, Cargill No. 14
10. Photograph of simple natural fracture termination, Mast No. A-1
11. Photograph of fracture termination at shale interbed, Howell No. 5
12. Photograph of complex natural fracture termination in a region of lithologic heterogeneity, Mast No. A-1
13. Photograph of fracture termination at a stylolite, SFE No. 2
14. Fracture intensity estimates for the upper and lower Travis Peak Formation at SFE No. 2 and Howell No. 5 wells
15. Variation in cumulative fracture length versus distance from the east-trending Waskom field monocline in the Travis Peak Formation
16. Structure map of part of Waskom field at the base of the Sligo Formation
17. Photomicrograph of ankerite precipitated over and enclosing faceted quartz crystals within natural fracture, Howell No. 5
18. SEM image and photomicrograph showing evidence of the precipitation sequence quartz - ankerite, Howell No. 5
19. SEM images of fracture-lining quartz, Howell No. 5 and SFE No. 2 wells
20. Zeolite mineralization in a fracture, Howell No. 5
21. Photomicrographs showing evidence of crack-seal deformation and mineralization sequence, Howell No. 5
22. Crack-seal model of fracture evolution based on observations in Travis Peak fractures
23. Photomicrographs illustrating transgranular fluid-inclusion planes (healed microfractures)
24. Histograms of the strike of transgranular fluid-inclusion planes at various depths, Howell No. 5
25. Relation of healed microfractures to other rock properties, burial depth, and other microstructures
26. SEM images of grain-boundary microcracks in quartz-cemented quartzarenite, Scott No. 5
27. Photograph of shear fracture, Howell No. 5
28. SEM images illustrating the shape of slickenlines on shear-fracture surface, Mast No. Al
29. Rose diagrams of mudstone fracture attitudes
30. SEM images of grain-size-reduction domains parallel to shear fracture in mudstone, Mast No. A-1
31. Alternative models of shear-fracture development in mudstone
32. M-pole plot based on shear-fracture attitudes, Cargill No..
33. Attitudes of coring-induced fractures in the Travis Peak Formation
34. Photograph of petal-centerline fracture and schematic diagram of typical shape
35. Sketch of aligned petal and petal-centerline fractures, SFE No. 2
36. Diagram showing reactivation of natural fracture by coring-induced fracture, Cargill No. 14
37. Histograms and stereonet showing direction of maximum horizontal stress from several stress direction indicators
38. Sketch of a hydraulic fracture induced by open-hole stress test 2, SFE No. 2
39. Burial-history curve, SFOT No. 1
40. Mohr circle representation of the stress history of the Travis Peak Formation and stress versus depth plots for rocks undergoing diagenesis at maximum burial
41. Map view of hypothetical interactions between natural fractures and hydraulically induced fractures propagating along stress trajectories
Tables
1. Wells for which fracture descriptions are available, Travis Peak Formation, East Texas
2. Natural mineralized fractures in eight Travis Peak wells
3. Oriented coring-induced petal-centerline and petal fractures in five Travis Peak wells
4. Summary of calculated strain orientations
5. Fractures created during stress tests
6. Silica solubility at various temperatures and pressures
Citation
Laubach, S. E., 1989, Fracture Analysis of the Travis Peak Formation, Western Flank of the Sabine Arch, East Texas: The University of Texas at Austin, Bureau of Economic Geology, Report of Investigations No. 185, 55 p.
