Reports of Investigations
-
Books & Reports
- Reports of Investigations
- Guidebooks
- Udden Series
- Geological Circulars
- Down To Earth
- Atlases of Major Oil and Gas Reservoirs
- Texas Memorial Museum Publications
- Environmental Geologic Atlas of the Texas Coastal Zone
- Mineral Resource Circulars
- Other Reports
- Seminars and Workshops
- Handbooks
- Submerged Lands of Texas
- Symposia
- Annual Reports
- Open File Reports
-
Maps & Cross Sections
- Thematic Maps
- Miscellaneous Maps, Charts & Sections
- Geologic Atlas of Texas
- STATEMAP Project Maps
- Geologic Quadrangle Maps
- Cross Sections
- Highway Geology Map
- Energy and Mineral Resource Maps
- Shoreline Change and Other Posters
- Wilcox Group, East Texas, Geological / Hydrological Folios
- Bouguer Gravity Atlas of Texas
- River Basin Regional Studies
- Featured Maps
- Posters
- Teachers & the Public
-
Geological Society Publications
- Gulf Coast Association of Geological Societies
- Alabama Geological Society
- Austin Geological Society
- Corpus Christi Geological Society
- Houston Geological Society
- Lafayette Geological Society
- Mississippi Geological Society
- New Orleans Geological Society
- South Texas Geological Society
- GCS SEPM Publications
- Historic BEG & UT Series
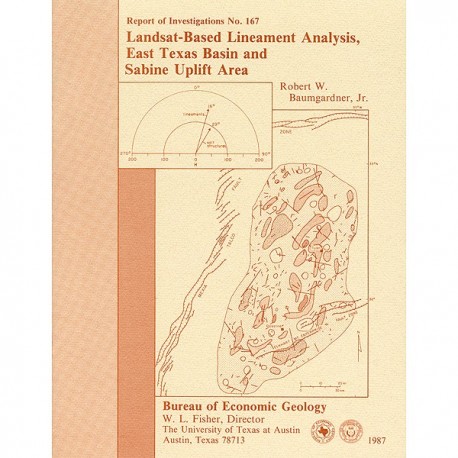
RI0167. Landsat-Based Lineament Analysis, East Texas Basin and Sabine Uplift Area, by R. W. Baumgardner, Jr. 26 p., 18 figs., 5 tables, 1987. ISSN: 0082335X: Print.
To purchase this publication as a downloadable PDF, please order RI0167D.
ABSTRACT
Lineament analysis was used to study the relationship between subsurface structure and surficial features in East Texas, southeastern Oklahoma, southwestern Arkansas, and northwestern Louisiana-areas of low topographic relief, moderate vegetation cover, and diverse land use. More than 2,200 lineaments were mapped from four standard 1:250,000-scale Landsat Thematic Mapper images. Operator error and data-base variation were evaluated in areas of sidelap between adjacent images. Because no significant difference (at p = .05 level) in lineament orientations or mean lineament length was detected in these areas, mapping error and differences between images were judged inconsequential. Vector sums of greater-than-average values of length-weighted frequency (F) were used to define significant peaks of lineament orientation. Regional orientation for all lineaments is bimodal, peaks being 325° and 21° azimuth. The northwest regional peak coincides with mean azimuth of borehole elongations in 50 wells located throughout East Texas. Within the salt structure province of the East Texas Basin, the azimuth of the vector sum for lineaments (16°) is not significantly different from that for underlying, elongated salt-related structures (29°) (salt diapirs, salt pillows, turtle structures). These observations suggest that lineaments and subsurface structures result from like-oriented stresses. Lineament density (length/unit area) was measured in 100-km2 grid cells throughout the study area to delineate some large structural features. An arcuate trend of high values (220 km/100 km2) demarcates the Mexia-Talco Fault Zone. Other density highs occur near the Angelina Flexure and the South Arkansas and Elkhart-Mt. Enterprise Fault Zones. Lineament density values have no consistent spatial relationship with salt-related structures, but their relatively small size probably makes these structures difficult to detect. These results indicate that high lineament density coincides with most major surface and subsurface structures in the study area. Furthermore, statistically significant lineament orientations coincide with azirnuths of elongated boreholes and deeply buried structures and may be diagnostic of regional and basinwide stress regimes.
Keywords: East Texas Basin, Gulf Coast stress province, Landsat lineament analysis, remote sensing, Sabine Uplift, salt structure province, Travis Peak Formation
CONTENTS
ABSTRACT
INTRODUCTION
Purpose and scope
Physiography and land cover
Previous work
METHODS AND MATERIALS
Imagery
Procedures
Definition of observed lineaments
RESULTS
Correspondence between lineaments and geologic features
Length-weighted frequency of lineament azimuths
Graphical display of results
Selection of polar graphs
Significance level of peaks
Definition and validity of peak values
Vector sums of greater-than-average peaks
Lineament density
Subregional lineament orientation
DISCUSSION
Relationship between lineaments and stress regime
Stress in study area
CONCLUSIONS
ACKNOWLEDGMENTS
REFERENCES
Figures
1. Location map of study area showing major tectonic elements and boundaries of Landsat images
2. Generalized geologic map of study area
3. Stratigraphic column of geologic formations
4. Spectral range of Landsat satellite sensors
5. Map of all Landsat lineaments mapped in study area
6. Examples of lineament types described from large-scale photographs
7. Procedure for statistical evaluation of lineament orientation data
8. Polar graphs of length-weighted frequency for lineaments in 12 subregional zones
9. Graph of index of preferred orientation
10. Polar graphs of vector sums of greater-than-average peaks of length-weighted frequency
11. Polar graphs of Bernshtein accuracy criterion for 12 subregional zones
12. Map of lineament density and major structural features
13. Boundaries of East Texas Basin and Sabine Uplift as defined by high values of lineament density
14. Polar graphs of Bernshtein accuracy criterion for lineaments, East Texas Basin and Sabine Uplift
15. Map of lineaments and salt-related structures in the salt structure province of the East Texas Basin
16. Polar graph of Bernshtein accuracy criterion for lineaments and elongate salt-related structures in the East Texas Basin
17. Models of faults related to doming
18. Map of breakouts in wells in the Schuler Formation, East Texas
Tables
1. Landsat Thematic Mapper images used in this study
2. Descriptions of lineaments checked against large-scale aerial photographs
3. Significant peaks for 5°- and 10°-wide-wide sectors
4. Data for 12 zones and 3 areas in order of increasing number of lineaments
5. Megalineaments and significant peaks of length-weighted frequency for 10°-wide sectors
Citation
Baumgardner, R. W., 1987, Landsat-Based Lineament Analysis, East Texas Basin and Sabine Uplift Area: The University of Texas at Austin, Bureau of Economic Geology, Report of Investigations No. 167, 26 p.


