Reports of Investigations
-
Books & Reports
- Reports of Investigations
- Guidebooks
- Udden Series
- Geological Circulars
- Down To Earth
- Atlases of Major Oil and Gas Reservoirs
- Texas Memorial Museum Publications
- Environmental Geologic Atlas of the Texas Coastal Zone
- Mineral Resource Circulars
- Other Reports
- Seminars and Workshops
- Handbooks
- Submerged Lands of Texas
- Symposia
- Annual Reports
- Open File Reports
-
Maps & Cross Sections
- Thematic Maps
- Miscellaneous Maps, Charts & Sections
- Geologic Atlas of Texas
- STATEMAP Project Maps
- Geologic Quadrangle Maps
- Cross Sections
- Highway Geology Map
- Energy and Mineral Resource Maps
- Shoreline Change and Other Posters
- Wilcox Group, East Texas, Geological / Hydrological Folios
- Bouguer Gravity Atlas of Texas
- River Basin Regional Studies
- Featured Maps
- Posters
- Teachers & the Public
-
Geological Society Publications
- Gulf Coast Association of Geological Societies
- Alabama Geological Society
- Austin Geological Society
- Corpus Christi Geological Society
- Houston Geological Society
- Lafayette Geological Society
- Mississippi Geological Society
- New Orleans Geological Society
- South Texas Geological Society
- GCS SEPM Publications
- Historic BEG & UT Series


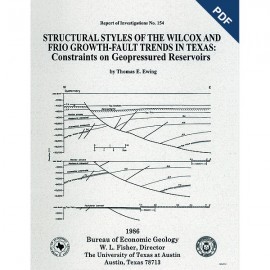
Structural Styles of the Wilcox and Frio Growth-Fault Trends in Texas: Constraints on Geopressured Reservoirs
RI0154
For a downloadable, digital version: RI0154D.
RI0154. Structural Styles of the Wilcox and Frio Growth-Fault Trends in Texas: Constraints on Geopressured Reservoirs, by T. E. Ewing. 86 p., 61 figs., 2 tables, 1986. ISSN: 0082335X: Print.
To purchase this publication as a downloadable PDF, please order RI0154D.
ABSTRACT
The wide variability in structural styles within the growth-faulted, geopressured trends of the Texas Gulf Coast is illustrated by detailed structural maps of selected areas of the Wilcox and Frio growth-fault trends and quantified by statistical analysis of fault compartment geometries. Structural variability is a key determinant of the size of geopressured aquifers in the deep subsurface.
Two major structural styles exist in the Wilcox trend. (1) In southeast and Central Texas, the trend consists of continuous, closely spaced faults that have little associated rollover despite moderate expansion of section; the fault plane flattens little with depth. Where the trend crosses the Houston Diapir Province, growth faults are localized by preexisting salt pillows; however, the salt diapirs pierced the growth-faulted horizons after the main phase of faulting, so that salt-related movement deforms the growth faults. (2) By contrast, in South Texas a narrow band of growth faults having high expansion and moderate rollover lies above and downdip of a ridge of deformed, overpressured shale but updip of a deep basin formed by withdrawal of overpressured shale. Large antithetic faults are associated with this band of faults.
Frio fault systems generally display greater rollover and wider spacing than do Wilcox fault systems; however, the Frio trend displays distinctive features in each study area. At Sarita in South Texas, shale mobilization produced shale ridges, one of which localized a low-angle growth fault. Shale mobilization at Corpus Christi produced a series of large growth faults, shale-cored domal anticlines, and shale-withdrawal basins, which become younger to the east. At Blessing, major growth faults show little progradation seaward. A major early-formed growth-fault system was deformed by later salt tectonism at Pleasant Bayou. At Port Arthur, low-displacement, long-lived faults formed on a sand-poor shelf margin contemporaneously with broad salt uplifts and basins. Most of the Frio growth faults, however, have a similar geometry, showing substantial rollover, expansion of section, and a moderate flattening of the fault zone with depth, possibly related to a deep decollement surface. Shale ridges are common but not ubiquitous. The local variability in style is related to the magnitude of Frio sedimentation and progradation and to the presence of thick salt or shale.
Data on the sizes and shapes of fault compartments in the Texas Gulf Coast growth-fault trends confirm substantial differences between the two fault systems. Frio compartments generally show less elongation and higher absolute curvature than do Wilcox compartments. The compartment areas in both trends are distributed exponentially (small compartments outnumber large ones). There are more very large compartments than the best-fit exponential model predicts, however. The observed distribution of fault compartment curvature is consistent with a simple trapezoidal model of their geometry.
Finding and developing a large geopressured aquifer require recognition of a favorable combination of sand-body geometry, reservoir quality, and fault compartment size and shape. In the Wilcox trend, reservoirs are predominantly dip-oriented sandstones of high-constructive deltaic origin. This geometry, together with the close spacing of faults and the characteristically low permeabilities, limits the size of geopressured reservoirs. The largest reservoirs in the Wilcox trend may be in areas between major fault trends or in salt- or shale-withdrawal basins. In the Frio trend, widely spaced faults and higher permeabilities are more favorable to reservoir development. Blocks showing dip reversal and salt- and shale-withdrawal basins were all found in the trend and are likely to contain large geopressured aquifers. Reservoir quality is the primary limitation.
Keywords: Gulf Coastal Plain, Texas, Tertiary, structural geology, clastic sediments, geopressure, faulting, salt tectonics, seismic surveys, geothermal energy
CONTENTS
ABSTRACT
INTRODUCTION
WILCOX GROWTH-FAULT SYSTEM
Katy study area
Stratigraphy
Structural development
Structural constraints on the occurrence of geopressured reservoirs
Fostoria dip section
Stratigraphy 4
Structural development
Structural constraints on the occurrence of geopressured reservoirs
Zapata study area
Stratigraphy
Structural development
Structural constraints on the occurrence of geopressured reservoirs
Discussion
FRIO GROWTH-FAULT SYSTEM
Corpus Christi study area
Stratigraphy
Structural development
Structural constraints on the occurrence of geopressured reservoirs
Sarita dip section
Stratigraphy
Structural development
Structural constraints on the occurrence of geopressured reservoirs
Port Arthur study area
Stratigraphy
Structural development
Structural constraints on the occurrence of geopressured reservoirs
Discussion
Comparison of structural styles of the five Frio study areas
Structural constraints on the occurrence of geopressured reservoirs
REGIONAL FAULT COMPARTMENT GEOMETRIES OF THE WILCOX AND FRIO TRENDS
Introduction
Methods
Discussion
Distributions
Models
Significance of analysis
CONCLUSIONS.
ACKNOWLEDGMENTS
REFERENCES
Figures
1. Growth-fault trends of the Texas part of the Gulf Coast Tertiary Basin; stratigraphic column
2. Location map showing study areas in the Wilcox growth-fault trend, Texas Gulf Coast, and their relation to the Rockdale and Rosita delta systems
3. Location map of Katy study area
4. Structure section A-A', Austin and Fort Bend Counties
5. Isopach map of upper and middle Wilcox strata, Katy study area
6. Schematic palinspastic sections across San Felipe area showing sequence of structural development
7. Structure map contoured on top of Wilcox strata, Katy study area
8. Isopach map of Vicksburg and Jackson strata, Katy study area
9. Structure section C-C' across San Felipe dome, Austin, Waller, and Fort Bend Counties
10. Structure map contoured on top of Vicksburg Formation, Katy study area
11. Map of Fostoria area, Liberty and Montgomery Counties, showing approximate locations of dip section and oil and gas production
12. Structural cross section of the Fostoria area
13. True-depth interpreted section of Fostoria area
14. Location map of Zapata study area
15. True-depth sections of Zapata study area
16. Structure map contoured on top of Wilcox strata, Zapata study area
17. Dip cross sections of Fandango field, restored to its appearance in middle and late Wilcox time
18. Structure map contoured on base of Yegua Formation, Zapata study area
19. Map of depositional systems of the Frio Formation showing locations of Frio geopressured trend study areas
20. Location map of sections and wells used, Corpus Christi study area
21. Stratigraphic diagram of Frio and related units, Corpus Christi study area, showing electric log correlation markers used in this study
22. Plot of interval velocity versus depth as determined from velocity surveys of four wells in the Corpus Christi study area
23. Structure map contoured on CC-1 (top of Frio) showing large oil-bearing structures
24. Structure map contoured on CC-4 (approximately Nonion struma)
25. Structure map contoured on CC-9 (approximately Textularia mississippiensis)
26. Structure map contoured on CC-11 (approximately Anomalina bilateralis)
27. Isopach map of the CC-1 to CC-4 interval (upper Frio)
28. Isopach map of the CC-4 to CC-9 interval (middle Frio)
29. Isopach map of the CC-9 to CC-11 interval (lower Frio)
30. Interpreted seismic section, Nueces County
31. Interpreted seismic section, Corpus Christi Bay, Nueces County
32. Structure section across a shale diapir, San Patricio County
33. Structure section along structural strike from Mobil-David dome to Bohemian Colony dome
34. True-depth sections A-A', southern Nueces County; B-B', northeastern Nueces County; and C-C', San Patricio County
35. Plot of distribution of fault-well intersections with depth, Corpus Christi study area
36. Structure map contoured on S5 horizon, Sarita prospect area
37. Structural dip section H–H', Sarita prospect
38. Structural dip section constructed near the seismic line
39. Seismic reflector facies interpretation of seismic line
40. Interpreted seismic section, Sarita dip line
41. True-depth structure section constructed from seismic line and well data
42. Palinspastic reconstructions (neglecting compaction) of western part of seismic line across Sarita prospect area
43. Location map of Port Arthur area showing well control, general locations of seismic lines, and locations of salt domes
44. Map showing regional distribution of sandstone-bearing lower Hackberry channels in Hackberry Embayment west of Acadia Parish, Louisiana
45. Interpreted dip- and strike-oriented seismic lines, Sabine Lake
46. Stratigraphic diagram of Frio and related strata, Jefferson County study area
47. Structure section C-C' near Port Arthur field and Spindletop dome
48. Plot of interval velocity versus depth for two velocity surveys and velocity analyses from seismic data
49. Isopach map of A3–Vicksburg interval, Port Arthur area
50. Isopach map of A3–A4 interval, Port Arthur area
51. Structure map contoured on A4 horizon, Port Arthur area
52. lsopach map of A1–A3 interval, Port Arthur area
53. Isolith map of Heterostegina limestone (middle Anahuac)
54. Structure map contoured on A2·horizon, Port Arthur area
55. Map of study area, Texas Gulf Coast, with numbers of closed compartments found per Tobin grid . . . . 56. Map of well density, Texas Gulf Coast, in wells per 620 mi2 (1,000 km2)
57. Diagram showing measurements performed on a typical Gulf Coast fault compartment
58. Histograms of size and shape parameters of the Wilcox trend
59. Histograms of size and shape parameters of the Frio trend
60. Plot of cumulative percentage of areas accounted for by blocks of less than a given area, Wilcox and Frio trends
61. Parallelogram and trapezoid models of fault compartments
Tables
1. Summary by sector of mean, 10th, 50th, and 90th percentiles for size and shape parameters, fault compartments of the Texas Gulf Coast
2. Cross-fault angles and validity tests for the parallelogram and trapezoid models as applied to Wilcox and Frio fault compartments
Citation
Ewing, T. E., 1986, Structural Styles of the Wilcox and Frio Growth-Fault Trends in Texas: Constraints on Geopressured Reservoirs: The University of Texas at Austin, Bureau of Economic Geology, Report of Investigations No. 154, 86 p.