Publication Details
Geolocation:
Get the Publication
$10.00
Abstract/Description:
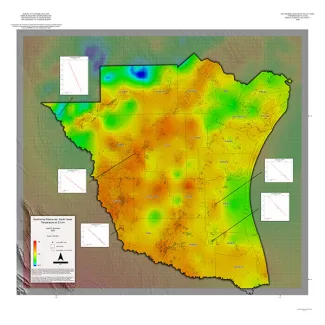
A series of two 1:500,000 scale maps showing the Geothermal resources of South Texas.
- Sheet 1: Gradient Map of temperature at 3.0km depth
- Sheet 2: Gradient Map of depth to 150 degrees C
Bottom Hole Temperature (BHT) data was acquired from the SMU Geothermal Lab and S&P Global's Energy Portal. From these data, thermal gradients from linear regressions were calculated across the study area in 5x5 km bins. These gradients and linear interpolation were used to calculate 21 rasters—ten temperature at depth (1-10km, 1km interval) and eleven depth to temperature (50-300°C, 25°C interval)—which were subsequently contoured and exported as shapefiles. Both raster and contour data are shown.
Thermal gradients, raster grids, and shapefiles were all processed, calculated, and generated using the Python programming languages (v3.7) including Scipy, Geopandas, Numpy, and Osgeo.gdal modules. Geothermal mapping and map production were supported by the USGS's National Cooperative Geologic Mapping Program (NCGMP) through STATEMAP and the Bureau of Economic Geology’s STARR funds for geothermal research.