Geological Circulars
-
Books & Reports
- Reports of Investigations
- Guidebooks
- Udden Series
- Geological Circulars
- Down To Earth
- Atlases of Major Oil and Gas Reservoirs
- Texas Memorial Museum Publications
- Environmental Geologic Atlas of the Texas Coastal Zone
- Mineral Resource Circulars
- Other Reports
- Seminars and Workshops
- Handbooks
- Submerged Lands of Texas
- Symposia
- Annual Reports
- Open File Reports
-
Maps & Cross Sections
- Thematic Maps
- Miscellaneous Maps, Charts & Sections
- Geologic Atlas of Texas
- STATEMAP Project Maps
- Geologic Quadrangle Maps
- Cross Sections
- Highway Geology Map
- Energy and Mineral Resource Maps
- Shoreline Change and Other Posters
- Wilcox Group, East Texas, Geological / Hydrological Folios
- Bouguer Gravity Atlas of Texas
- River Basin Regional Studies
- Featured Maps
- Posters
- Teachers & the Public
-
Geological Society Publications
- Gulf Coast Association of Geological Societies
- Alabama Geological Society
- Austin Geological Society
- Corpus Christi Geological Society
- Houston Geological Society
- Lafayette Geological Society
- Mississippi Geological Society
- New Orleans Geological Society
- South Texas Geological Society
- GCS SEPM Publications
- Historic BEG & UT Series
3-D Seismic Interpretation of Deep, Complex Structures
GC9901
For a downloadable, digital version: GC9901D.
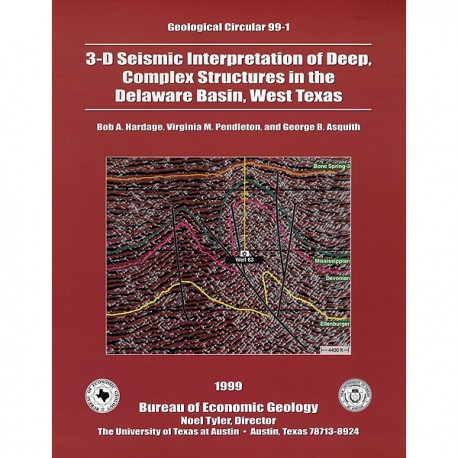
GC9901. 3-D Seismic Interpretation of Deep, Complex Structures in the Delaware Basin, West Texas, by B. A. Hardage, V. M. Pendleton, and G. B. Asquith. 42 p., 31 figs., 1 table, 1999. ISSN: 0082-3309: Print.
To purchase this publication as a PDF download, please order GC9901D.
ABSTRACT
A multidisciplinary reservoir-characterization study of the Ellenburger Group was conducted over a 176-mi2 3-D seismic grid in Pecos, Reeves, and Ward Counties in the southern Delaware Basin of West Texas. The study area covered Lockridge, Waha, and West Waha fields and parts of Worsham-Bayer and Coyanosa fields, which have produced 1.3 trillion standard cubic feet of natural gas since their discoveries in the 1960's. Seismic time-structure and depth maps were generated for the tops of the Bone Spring-3, Mississippian, Devonian (Woodford), and Ellenburger. The focus of the study was to determine whether productive Ellenburger facies could be detected and mapped by using surface-recorded seismic data. No seismic attribute could be found, however, that exhibited any significant correlation with Ellenburger production. Systems of complex faults were interpreted across the 176-mi2 3-D image space.
The structural maps that were created are thought to be some of the most accurate depictions of the subsurface structure that are publicly available in this area of the Delaware Basin. Particular attention was given to documenting the overturned bedding and repeated sections that are associated with the interpreted fault systems. Both well log and 3-D seismic evidence of these tectonic folds and repeated reverse faults is presented. Natural gas production in the Lockridge-Waha region seems to be directly related to fracturing. The best gas production in Ellenburger, Devonian (Thirtyone), and Mississippian reservoirs in this study area occurs where wells are positioned close to faults and tends to increase as fault displacement and stratal distortion increase. The best production in the Lockridge-Waha region seems to be associated with reverse faults and with overturned sections. Wells should therefore be sited where they will penetrate the maximum number of fractured strata. From a 3-D seismic interpretation perspective, the requirement for siting productive wells is to place the well bore where seismic data allow an interpreter to infer that significant stratal movement and distortion have occurred because these rock deformation processes are indirect, but valuable, indicators of fracturing.
Keywords: Delaware Basin, Ellenburger, overturned beds, repeated sections, reverse faults, 3-D seismic
CONTENTS
Abstract
Introduction
3-D Seismic Data Acquisition and Processing
Seismic-Based Time-Structure Maps
Time-to-Depth Calibration
Acoustic-Log Control
Type Logs
Synthetic Seismogram Calibration of the 3-D Seismic Image
Deviated Wells
Low-Frequency Images and Fault Enhancement
Amplitude Attributes
Seismic-Based Depth Maps
Fault Styles
Overturned Beds
Simpson Example (Well 78)
Devonian Example (Well 63)
Reverse Faults and Repeated Sections
Simpson Example (Well 72)
Relation of Productive Facies to Faults
Seismic Isochron Maps and Their Tectonic Implications
New Geologic Information Provided by Lockridge-Waha 3-D Seismic
New Structural Insights
High-Potential Drilling Areas
Conclusions
Acknowledgments
References
Figures
1. Location map of study area
2. Stratigraphic column of the Delaware Basin
3. Top of Bone Spring-3 structure interpreted from Lockridge-Waha 3-D seismic data
4. Top of Mississippian structure interpreted from Lockridge-Waha 3-D seismic data
5. Top of Devonian (base Woodford) structure interpreted from Lockridge-Waha 3-D seismic data
6. Ellenburger structure interpreted from Lockridge-Waha 3-D seismic data
7. Traveltime-vs-depth behavior from 17 check-shot wells near Lockridge-Waha 3-D seismic survey
8. Traveltime-vs-depth behavior measured in four check-shot wells inside Lockridge-Waha 3-D seismic grid
9. Example synthetic seismogram calculation
10. Example of synthetic seismogram correlation with 3-D seismic image
11. Unfiltered and uninterpreted version of crossline 460
12. Uninterpreted version of crossline 460 after 3-D data are filtered to emphasize frequency content in lowest octave of the signal spectrum
13. Unfiltered and uninterpreted version of inline 970
14. Uninterpreted version of inline 970 after 3-D data are filtered to emphasize frequency content in lowest octave of the signal spectrum
15. RMS amplitude of Ellenburger reflection events as defined by full-bandwidth 3-D data volume
16. RMS amplitude of Ellenburger facies in low-frequency data volume
17. Seismic-based depth map of top of Bone Spring-3
18. Seismic-based depth map of top of Mississippian
19. Seismic-based depth map of top of Devonian (base Woodford)
20. Seismic-based depth map of top of Ellenburger
21. Example of folded Simpson section, well 78
22. Conceptual diagram showing apparent bed thickening caused by overturned bedding
23. Acoustic-neutron crossplot of typical Ellenburger section in Lockridge-Waha area
24. Acoustic-neutron crossplot of interval of well 78 incorrectly defined as Ellenburger
25. Seismic section passing through well 78
26. Logs showing overturned Devonian section observed in well 63
27. Seismic section passing through overturned Devonian section documented in well 63
28. Acoustic and gamma-ray logs recorded in well 72
29. Vertical section from 3-D seismic volume that passes through well 72
30. Isochron map of Ellenburger to Mississippian interval
31. Isochron map of Bone Spring-3 to Mississippian interval
Table
1. Velocity check-shot control
Citation
Hardage, B. A., Pendleton, V. M., and Asquith, G. B., 1999, 3-D Seismic Interpretation of Deep, Complex Structures in the Delaware Basin, West Texas: The University of Texas at Austin, Bureau of Economic Geology, Geological Circular 99-1, 42 p.
