Reports of Investigations
-
Books & Reports
- Reports of Investigations
- Guidebooks
- Udden Series
- Geological Circulars
- Down To Earth
- Atlases of Major Oil and Gas Reservoirs
- Texas Memorial Museum Publications
- Environmental Geologic Atlas of the Texas Coastal Zone
- Mineral Resource Circulars
- Other Reports
- Seminars and Workshops
- Handbooks
- Submerged Lands of Texas
- Symposia
- Annual Reports
- Open File Reports
-
Maps & Cross Sections
- Thematic Maps
- Miscellaneous Maps, Charts & Sections
- Geologic Atlas of Texas
- STATEMAP Project Maps
- Geologic Quadrangle Maps
- Cross Sections
- Highway Geology Map
- Energy and Mineral Resource Maps
- Shoreline Change and Other Posters
- Wilcox Group, East Texas, Geological / Hydrological Folios
- Bouguer Gravity Atlas of Texas
- River Basin Regional Studies
- Featured Maps
- Posters
- Teachers & the Public
-
Geological Society Publications
- Gulf Coast Association of Geological Societies
- Alabama Geological Society
- Austin Geological Society
- Corpus Christi Geological Society
- Houston Geological Society
- Lafayette Geological Society
- Mississippi Geological Society
- New Orleans Geological Society
- South Texas Geological Society
- GCS SEPM Publications
- Historic BEG & UT Series
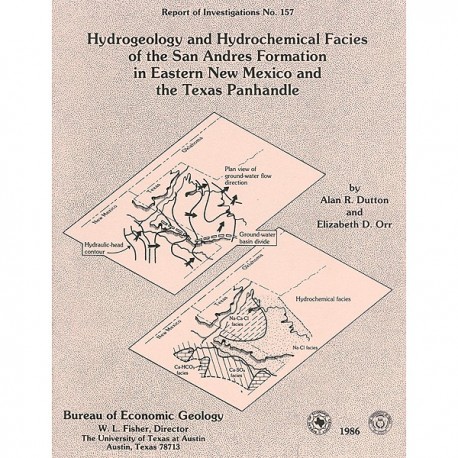
Hydrogeology and Hydrochemical Facies of the San Andres Formation in Eastern New Mexico and the Texas Panhandle
RI0157
For a downloadable, digital version: RI0157D.
RI0157. Hydrogeology and Hydrochemical Facies of the San Andres Formation in Eastern New Mexico and the Texas Panhandle, by A. R. Dutton and E. D. Orr. 58 p., 13 figs., 3 tables, 3 appendices, 1986. ISSN: 082335X: Print.
To purchase this publication as a downloadable PDF, please order RI0157D.
ABSTRACT
Fluid pressure, permeability, rates and patterns of ground-water flow, and chemical and isotopic composition of ground water in carbonate rock in the lower part of the San Andres Formation (Permian) in eastern New Mexico and the Texas Panhandle were studied to characterize the origin and movement of brine within an evaporite-carbonate-shale confining system. Although hydraulic-head data and numerical models suggest that ground water flows downward through the evaporite confining system in the Palo Duro Basin of the Texas Panhandle, evidence derived from study of chemical and isotopic composition of brine from two test wells indicates that post-Permian groundwater movement in the unit 4 carbonate bed of the San Andres Formation has been negligible in the Palo Duro Basin. The conflict between the chemical interpretation and the hydrologic model predictions can be reconciled if (1) the amount of ground-water flow since a significant cross-formation gradient in hydraulic head developed during the Pleistocene has not been enough to flush connate brine from carbonate beds, (2) present ground-water flow is unevenly distributed between fractured and unfractured zones in the evaporite confining system, and (3) brine sampled at test wells differs from other waters in fractured zones not yet sampled.
Hydraulic head of ground water in the San Andres Formation appears to be hydrodynamically controlled by land-surface topography and by production of hydrocarbons and formation water. A ground-water-basin divide inferred from a fold in the potentiometric surface corresponds to the Western Caprock Escarpment and indicates that San Andres ground water below the Southern High Plains is separated from the karstic aquifer in the San Andres Formation in the Pecos Plains. The separation is reflected in a marked difference in hydrochemical facies and salinity. San Andres ground water varies from Ca-HCO3 and Ca-SO4 hydrochemical types with salinities of less than 5,000 mg/L in the Pecos Plains of eastern New Mexico to Na-Cl and Ca-C1 brines with salinities of 336,000 to 384,000 mg/L and Na/CI mole ratios of as low as 0.2 beneath the Southern High Plains, east of the ground-water-basin divide. The groundwater-basin divide probably developed during the Pleistocene when the ancestral Pecos River excavated its valley.
Similarity between δD (-15 ‰ to -26 ‰)and δ18O (+4 ‰ to 6.4 ‰) of San Andres ground water in the Palo Duro Basin and δD and δ18O of fluid inclusions in halite beds suggests that brine in the carbonate rock could have originated during the Permian as evaporatively concentrated seawater. Dolomitization, ion exchange, clay diagenesis, and loss of dissolved sulfate account for possible modifications of the hypothetical Permian connate brine. However, with a meteoric-water model for brine origin, extensive rock-water reactions, such as ion- and isotope-exchange and incongruent recrystallization of halite, are needed to derive the observed composition. Isotopic exchange between meteoric water and San Andres carbonate rocks cannot account for δ18O composition of San Andres Formation brine. The reactions needed in a meteoric-water model seem more complex and less documented than simple preservation of a modified-connate, Permian brine.
Keywords: hydrogeology, hydrochemical facies, confining systems, brine, evaporites, drill-stem testing, San Andres Formation, Texas Panhandle, eastern New Mexico, Palo Duro Basin
CONTENTS
ABSTRACT
INTRODUCTION
HYDROGEOLOGIC SETTING
DATA
Hydraulic-Head Data
Chemical Data
RESULTS OF HYDROGEOLOGIC STUDIES
Hydrologic Tests
Ground-Water Flow
Preservation of Permian Formation Water
Vertical Flow from Adjacent Formations
Intrastratal Recharge before Pecos River Valley Incision
RESULTS OF HYDROCHEMICAL STUDIES
DISCUSSION Connate-Brine Explanation
Isotopic Composition
Na/ Cl Ratio
Salinity Patterns
Meteoric-Water Explanation
Isotopic Composition
Na/Cl Ratio
Salinity Patterns
CONCLUSIONS
ACKNOWLEDGMENTS23
REFERENCES
APPENDIX A. Hydrologic Test Data
APPENDIX B. Geostatistical Analysis of Hydraulic Head
APPENDIX C. Chemical Composition of Ground Water in the San Andres Formation
FIGURES
1. Study area, lying between outcrops of Guadalupian rocks in eastern New Mexico and the Texas Panhandle
2. Stratigraphic and lithologic data, San Andres Formation and evaporite confining system
3. Locations of stratigraphic and hydrologic test wells in the Palo Duro Basin
4. Plot of fluid pressure against depth in the San Andres Formation
5. Potentiometric-surface map of the San Andres Formation prepared by hand-contouring hydraulic-head data
6. Plot of fluid pressures in San Andres oil fields prior to and in 1943
7. Trilinear diagram of major ions in San Andres ground water
8. Hydrochemical facies and salinity of ground water in the San Andres Formation
9. Saturation state of San Andres ground water relative to anhydrite and halite
10. Saturation state of San Andres ground water relative to calcite and dolomite
11. Plots of chloride versus sodium and chloride versus sodium+calcium+magnesium in San Andres ground water
12. Isotopic composition of brine from the SWEC Zeeck No. 1 and SWEC J. Friemel No. 1 wells
13. Oxygen isotopic composition of brine as a function of temperature and isotopic composition of dolomite and calcite
TABLES
1. Hydraulic head of San Andres brine in the Palo Duro Basin
2. Chemical and isotopic composition of San Andres brine from test wells
3. Ion content of San Andres brine calculated by meteoric-water model
APPENDIX FIGURES
A1. Geophysical logs and drill-stem-test zones at six SWEC hydrologic test wells
A2. Change in fluid pressure with time and summary of test data during two flow and shut-in periods of drill-stem test 1 at the SWEC G. Friemel No. 1 well
A3. Plots of data and calculated values of permeability from drill-stem test 1 at the SWEC G. Friemel No. 1 well
A4. Change in fluid pressure with time and summary of test data during two flow and shut-in periods of drill-stem test 3 at the SWEC Detten No. 1 well
AS. Plots of data and calculated values of permeability from drill-stem test 3 at the SWEC Detten No. 1 well
A6. Change in fluid pressure with time and summary of test data during two flow and shut-in periods of drill-stem test 5 at the SWEC Zeeck No. 1 well
A7. Plots of data and calculated values of permeability from drill-stem test 5 at the SWEC Zeeck No. 1 well
A8. Schematic drawing of test setup at the SWEC Zeeck No. 1 well during fluid production and four shut-in tests
A9. Plots of data and calculated values of permeability from shut-in tests at the SWEC Zeeck No. 1 well
A10. Change in fluid pressure with time and summary of test data during flow and shut-in periods of drill-stem test 2 at the SWEC Harman No. 1 well
A11. Plots of data and calculated values of permeability from drill-stem test 2 at the SWEC Harman No. 1 well
A12. Change in fluid pressure with time and summary of test data during two flow and shut-in periods of drill-stem test 5 at the SWEC J. Friemel No. 1 well
A13. Plots of data and calculated values of permeability from drill-stem test 5 at the SWEC J. Friemel No. 1 well
A14. Schematic drawing of test setup at the SWEC J. Friemel No. 1 well during fluid production and shut-in tests
A15. Change in fluid pressure with time and summary of test data during flow and shut-in periods at the SWEC J. Friemel No. 1 well
A16. Plots of data and calculated values of permeability from shut-in tests at the SWEC J. Friemel No. 1 well
A17. Plots of data and calculated values of permeability from drill-stem test 5 at the SWEC Holtzclaw No. 1 well
B1. Potentiometric-surface map of the San Andres Formation made by kriging
B2. Variogram of hydraulic-head data and theoretical variogram based on a spherical model
APPENDIX TABLES
A1. Hydrologic test data from SWEC Zeeck No. 1 shut-in and SWEC Holtzclaw No. 1 drill-stem tests
A2. History of fluid production at the SWEC Zeeck No. 1 well
A3. History of fluid production at the SWEC J. Friemel No. 1 well
B1. Geostatistical parameters used to determine the potentiometric surface of the San Andres Formation by kriging
Citation
Dutton, A. R., and Orr, E. D. 1986, Hydrogeology and Hydrochemical Facies of the San Andres Formation in Eastern New Mexico and the Texas Panhandle: The University of Texas at Austin, Bureau of Economic Geology, Report of Investigations No. 157, 58 p.
