Geological Circulars
-
Books & Reports
- Reports of Investigations
- Guidebooks
- Udden Series
- Geological Circulars
- Down To Earth
- Atlases of Major Oil and Gas Reservoirs
- Texas Memorial Museum Publications
- Environmental Geologic Atlas of the Texas Coastal Zone
- Mineral Resource Circulars
- Other Reports
- Seminars and Workshops
- Handbooks
- Submerged Lands of Texas
- Symposia
- Annual Reports
- Open File Reports
-
Maps & Cross Sections
- Thematic Maps
- Miscellaneous Maps, Charts & Sections
- Geologic Atlas of Texas
- STATEMAP Project Maps
- Geologic Quadrangle Maps
- Cross Sections
- Highway Geology Map
- Energy and Mineral Resource Maps
- Shoreline Change and Other Posters
- Wilcox Group, East Texas, Geological / Hydrological Folios
- Bouguer Gravity Atlas of Texas
- River Basin Regional Studies
- Featured Maps
- Posters
- Teachers & the Public
-
Geological Society Publications
- Gulf Coast Association of Geological Societies
- Alabama Geological Society
- Austin Geological Society
- Corpus Christi Geological Society
- Houston Geological Society
- Lafayette Geological Society
- Mississippi Geological Society
- New Orleans Geological Society
- South Texas Geological Society
- GCS SEPM Publications
- Historic BEG & UT Series
Electrical Imaging Catalog: Microresistivity Images and Core Photos from Fractured, Karsted, and Brecciated Carbonates
GC9702
For a downloadable, digital version: GC9702D.
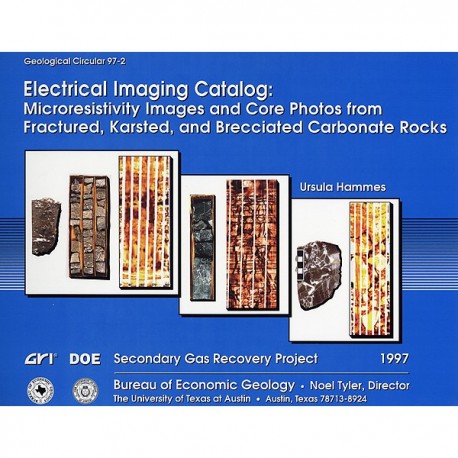
GC9702. Electrical Imaging Catalog: Microresistivity Images and Core Photos from Fractured, Karsted, and Brecciated Carbonate Rocks, by Ursula Hammes. 40 p., 32 figs., 1997. ISSN: 0082-3309. Print.
To purchase this publication as a downloadable PDF, please order GC9702D.
About This Publication
This study provides a comprehensive comparison of carbonate features in cores with a suite of electrical imaging logs. More than 20 Lower Ordovician Ellenburger Group cores were logged, described, and photographed, and more than 15 electrical imaging logs were interpreted. Funded by the Gas Research Institute and the U.S. Department of Energy.
ABSTRACT
Electrical images in boreholes are becoming increasingly important in interpreting the rock record. In addition to identifying fractures and faults, borehole imaging tools are used in a variety of other applications, such as horizontal drilling; environmental studies; stress-orientation-measurement studies; sequence stratigraphy; and paleotransport, facies, and diagenetic analyses. These tools produce electrical microconductivity images of the well bore, which are interpreted at an interactive graphics workstation, High-resolution (-2.5-mm) and nearly complete borehole coverage can greatly increase the detail and precision of geological interpretations. Yet, to be fully useful, borehole images should be calibrated with core. This study provides the first comprehensive comparison of carbonate features in cores with a suite of all currently available electrical imaging logs. The Lower Ordovician Ellenburger Group, West Texas, serves as a model of a dolomitized, fractured, karsted, and brecciated carbonate reservoir.
Characteristic reservoir features, including fracture breccia, chaotic breccia, laminated mudstones, grainstones, and bioturbation, are identified both on electrical imaging logs and in cores. Electrical images provide more complete information than do cores in cavernous and highly fractured zones because cores either commonly show no recovery or occur as rubble in these zones, which are the most productive in the Ellenburger reservoir. Borehole imaging therefore not only provides in situ visualization of cavernous porosity, chaotic breccias or conglomerates, and highly fractured intervals, but also provides other key insights into karst stratigraphy.
Keywords: breccias, carbonates, core images, electrical microresistivity images, Ellenburger Group, fractures, karst, West Texas
CONTENTS
Abstract
Introduction
Overview of Electrical Imaging Tools
History
FMI-FMS Logging Tools
EMI Logging Tool
Western Atlas Imaging Tool
Imaging Principles
Workstation Procedures
Images of the Ellenburger Group
Geology of the Ellenburger Group
Carbonate Features in Cores and Imaging Logs
Fractures
Depositional fabrics
Postdepositional fabrics
Quality-Control Measures
Summary
Acknowledgments
References
Figures
1. Location map of study area in West Texas
2. Schematic representation of FMI tool
3. Schematic representation of EMI tool
4. Schematic representation of STAR Imager
5. Electrical images derived from microresistivity measurements of an array of electrodes aligned on a pad
6. Interpretation guidelines for differentiating features on electrical images in carbonates
7. Schematic representation of breccia types in Ellenburger paleokarst deposits
8. Images characteristic of artificial fractures
9. Illustration featuring a fracture plane that intersects the cylindrical borehole surface at an inclined angle to the borehole axis
10. FMI image and core photos of a dolomudstone
11. FMI image and core photos of a mottled dolomudstone
12. EMI image and core photos of a dolomudstone
13. FMI image and core photos of a laminated dolomudstone facies
14. FMS image and cores of a laminated dolomudstone
15. FMI image and core photos of a bioturbated dolomudstone
16. FMI image and core photos of a bioturbated dolomudstone displaying resistivity patterns on the electrical images slightly different from those in figure 15
17. EMI image and core photos of a dolograinstone
18. FMI image and core photos of vuggy and solution-enlarged porosity in a dolograinstone
19. EMI image and core photos of a fracture breccia
20. FMI image and core photos of a fracture breccia
21. EMI images and core photo of a fracture breccia
22. EMI image and core photos of a mosaic breccia
23. FMI image and core photos of a mosaic breccia
24. EMI image and core photos of a carbonate-matrix-supported chaotic breccia
25. FMI image and core photos of a carbonate-matrix-supported chaotic breccia
26. FMS image and core photos of a carbonate-matrix-supported chaotic breccia
27. FMI image and core photos of a chaotic breccia
28. FMS image and matching core photo of carbonate-matrix-supported chaotic breccia
29. FMS image and matching core photo of highly altered dolomite host rock and carbonate-matrix-supported chaotic breccia
30. FMS image and matching core photos of a carbonate-matrix-supported breccia
31. EMI image and core photo displaying unconformity on top of the Ellenburger group
32. EMI image and core photos displaying cave-fill sequence having a shale layer on top reflected as a highly conductive, slightly sinusoidal, 6-inch-thick (1 5-cm) layer underlain by resistive, large carbonate and shale clasts in a low-resistivity, siliciclastic matrix
Citation
Hammes, Ursula, 1997, Electrical Imaging Catalog: Microresistivity Images and Core Photos from Fractured, Karsted, and Brecciated Carbonate Rocks: The University of Texas at Austin, Bureau of Economic Geology, Geological Circular 97-2, 40 p.
