Reports of Investigations
-
Books & Reports
- Reports of Investigations
- Guidebooks
- Udden Series
- Geological Circulars
- Down To Earth
- Atlases of Major Oil and Gas Reservoirs
- Texas Memorial Museum Publications
- Environmental Geologic Atlas of the Texas Coastal Zone
- Mineral Resource Circulars
- Other Reports
- Seminars and Workshops
- Handbooks
- Submerged Lands of Texas
- Symposia
- Annual Reports
- Open File Reports
-
Maps & Cross Sections
- Thematic Maps
- Miscellaneous Maps, Charts & Sections
- Geologic Atlas of Texas
- STATEMAP Project Maps
- Geologic Quadrangle Maps
- Cross Sections
- Highway Geology Map
- Energy and Mineral Resource Maps
- Shoreline Change and Other Posters
- Wilcox Group, East Texas, Geological / Hydrological Folios
- Bouguer Gravity Atlas of Texas
- River Basin Regional Studies
- Featured Maps
- Posters
- Teachers & the Public
-
Geological Society Publications
- Gulf Coast Association of Geological Societies
- Alabama Geological Society
- Austin Geological Society
- Corpus Christi Geological Society
- Houston Geological Society
- Lafayette Geological Society
- Mississippi Geological Society
- New Orleans Geological Society
- South Texas Geological Society
- GCS SEPM Publications
- Historic BEG & UT Series
Sedimentary Record of...Salt Movement, East Texas Basin: ... Digital Download
RI0139D
A free, digital version of this publication can be found on: Texas ScholarWorks
To purchase a print version (if available): RI0139
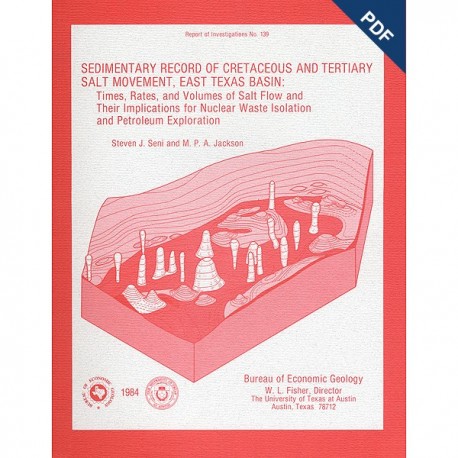
RI0139D. Sedimentary Record of Cretaceous and Tertiary Salt Movement, East Texas Basin: Times, Rates, and Volumes of Salt Flow and Their Implications for Nuclear Waste Isolation and Petroleum Exploration, by S. J. Seni and M. P. A. Jackson, assisted by R. E. Bramson, R. J. Burks, R. D. Conti, S. A. Ghazi, S. E. Lovell, B. C. Richter, J. L. Smith, and D. H. Wood. 89 p., 57 figs., 7 tables, 1984. doi.org/10.23867/RI0139D. Downloadable PDF.
To purchase this publication in book format, please order RI0139.
Excerpted from the ABSTRACT
Post-Aptian strata (younger than 112 ma) in the East Texas Basin were strongly influenced by halokinesis and recorded the evolution associated sate structures. Comparisons with model diapirs and dome-induced changes in patterns of sandstone distribution, depositional facies, and reef growth indicate that thickness variations in strata surrounding domes were caused by syndepositional processes rather than by tectonic distortion.
Salt domes in the East Texas Basin exhibit three stages of growth: pillow, diaper, and postdiapir. Each stage affected surrounding strata differently. Pillow growth caused broad uplifting of strata over the crest of the pillows. The resulting topographic swells influenced depositional trends and were susceptible to erosion. Fluvial-channel systems bypassed pillow crests and stacked vertically in primary peripheral sinks on the updip flanks of the pillows. Diapir growth was characterized by expanded sections of shelf and deltaic strata in secondary peripheral sinks around the diapirs. Lower Cretaceous (Aptian stage) reefs on topographic saddles between secondary peripheral sinks now host major oil production at Fairway Field. Postdiapir crestal uplifting and peripheral subsidence affected smaller areas than did equivalent processes that occurred during pillow or diaper stages…
Long-term and recent rates of dome growth in East Texas indicate a low probability that future dome uplift will breach an intradomal waste repository. During deposition of the Eocene Wilcox Group, fine-grained floodplain sediments accumulated over and around active diapirs in the East Texas Basin, including Oakwood salt dome. These fine-grained sediments now sheathing diapirs are aquitards favorable for waste isolation. However, sand-rich channel facies in rim synclines commonly surround the fine-grained sheath and constitute interconnected aquifers around diapirs. A potential pathway for radionuclides leaking from a dome could occur if interconnected aquifers intercept the dome. Dome-specific facies variability is difficult to detect because the variability commonly exceeds available well spacing. Site characterization of a potential waste repository must therefore be based on dense well control and on an understanding of dome growth history and diapiric processes in order to better predict facies distributions around domes.
Facies variations over and around domes at different stages of growth enable prediction of the location of subtle, facies-controlled hydrocarbon traps. These facies traps are likely to be the only undiscovered traps remaining in mature petroliferous basins such as the East Texas Basin.
Keywords: Cretaceous-Tertiary, depositional facies, East Texas Basin, petroleum exploration, petroleum traps, rates of dome growth, salt domes, salt tectonics, stress-strain, waste disposal
CONTENTS
ABSTRACT
INTRODUCTION
Data base
Early history of basin formation and filling
Geometry of salt structures
EVOLUTIONARY STAGES OF DOME GROWTH
Pillow stage
Geometry of overlying strata
Geometry of surrounding strata
Depositional facies and lithostratigraphy
Diapir stage
Geometry of surrounding strata
Depositional facies and lithostratigraphy
Postdiapir stage
Geometry of surrounding strata
Depositional facies and lithostratigraphy
Holocene analogs
Summary
Formation of subtle petroleum traps
PATTERNS OF SALT MOVEMENT IN TIME AND SPACE
Group 1 diapirs: Pre-Glen Rose Subgroup (pre-112 Ma)
Group 2 diapirs: Glen Rose Subgroup to Washita Group (112 to 98 Ma)
Group 3 diapirs: Post-Austin Group (86 to 56 Ma)
Initiation and acceleration of salt flow
Overview of dome history
RATES OF SALT MOVEMENT AND DOME GROWTH
Propositions
Proven propositions
Unproven propositions
Simplified propositions
Distinguishing between syndepositional and postdepositional thickness variations
The problem
Structural evidence
Sedimentological evidence
Methodology
Distinguishing between regional and salt-related thickness variations
Calculating volumes of salt mobilized and of salt lost
Rates of dome growth
Net rates of pillow growth
Net rates of diapir growth
Gross rates of diapir growth
Growth rates and strain rates
IMPLICATIONS FOR WASTE ISOLATION
CONCLUSIONS
ACKNOWLEDGMENTS
REFERENCES
APPENDICES
1. Calculation of diapiric strain rates from diapiric growth rates
2. List of wells by cross sections
Figures
1. Location map showing the East Texas Basin and surrounding area
2. Index map of the East Texas Basin showing cross-section lines and logged wells
3. Stratigraphic column of the East Texas Basin
4. Schematic cross sections showing evolution of the East Texas Basin and the Gulf of Mexico
5. Schematic block diagrams of facies around salt structures during early evolution of the East Texas Basin
6. Isometric block diagrams of salt structures in the East Texas Basin
7. Structure map showing four salt provinces in the East Texas Basin
8. Schematic stages of dome growth and characteristics of strata, East Texas Basin
9. Mapped areas of stratal thinning over salt pillows in the East Texas Basin
10. Southwest-northeast cross section and map, Hainesville Dome
11. Map of primary peripheral sinks, East Texas Basin
12. Map of net sandstone, Paluxy Formation
13. Cross section D-D', Paluxy Formation, across Van, Hainesville, and Hawkins salt structures
14. Schematic cross sections showing inferred evolution of salt structures.
15. Map of secondary peripheral sinks, East Texas Basin
16. Cross section U-U', Hainesville Dome area
17. lsopach map, Lower Taylor Formation - Austin Group, Hainesville Dome area
18. lsopach map of salt-withdrawal basins, Paluxy and Walnut Formations
19. lsopach map of salt-withdrawal basins, Washita Group
20. lsopach map of salt-withdrawal basins, Glen Rose Subgroup
21. Cross section Z-Z', Glen Rose Subgroup.
22. Cross section X-X', and maps of isopach, net sandstone, and structure, Paluxy Formation
23. Map of tertiary peripheral sinks, Wilcox Group, southern part of the East Texas Basin
24. Sand-percent map, Wilcox Group
25. Cross section B-B', Wilcox Group, Bethel Dome area
26. Cross section A-A', Wilcox Group, Oakwood Dome area
27. Relation between above-dome topography and surficial sand distribution, Upper Texas Gulf Coast
28. Location map of Hormuz salt plugs and Yas Island salt dome, Persian Gulf
29. Schematic block diagrams of facies around salt structures during late evolution of the East Texas Basin
30. Schematic cross section through a mature diapir showing typical facies variations and potential petroleum traps
31. Three groupings of domes in the East Texas Basin based on the timing of stages of salt movement
32. Map of three age groups of salt diapirs in the East Texas Basin
33. Regional isopach map, Glen Rose Subgroup
34. Regional isopach map, Paluxy and Walnut Formations
35. Regional isopach map, Lower Taylor Formation and Austin Group
36. Technique for calculating the volume of a salt-withdrawal basin
37. Dome-growth-rate curves calculated on the basis of compacted and decompacted sediments, East Texas Basin
38. Percentage thickness change around selected diapirs and pillows in the East Texas Basin
39. Fold-shape analysis
40. Cross sections of model domes
41. Measurement of isochore thickness parameters in model domes
42. Histograms showing frequency distribution of thickness changes in model domes
43. Comparison of axial-trace positions for salt domes in the East Texas Basin and for model domes
44. Cross sections of Hainesville, Grand Saline, and Keechi Domes
45. Methods of calculating net and gross rates of dome growth
46. Histograms of thickness and rate of regional sediment accumulation of major stratigraphic units in the East Texas Basin
47. Cumulative-probability curves of sediment-accumulation rate in the East Texas Basin
48. Contour map showing sample grid spacing and standard deviation of sediment-accumulation rate, Lower Taylor Formation and Austin Group
49. Histogram of the volumes of salt-withdrawal basins and volumetric rates at which salt-withdrawal basins were filled in the East Texas Basin
50. Histogram of the volumes of salt-withdrawal basins for diapirs in the East Texas Basin
51. Net rates of salt-pillow growth, East Texas Basin
52. Maximum net rates of dome growth, Oakwood and Hainesville Domes
53. Maximum net rates of dome growth and mean rate of regional sediment accumulation in the East Texas Basin
54. Residual rates of dome growth for 16 East Texas salt domes
55. Gross rates of dome growth in the East Texas Basin
56. Hypothetical gross and actual heights of diapirs in the East Texas Basin
57. Comparison of published net and gross rates and methods of dome growth
Tables
1. Net rate of pillow growth, East Texas Basin
2. Net rate of diapir growth, East Texas Basin
3. Gross rate of diapir growth, East Texas Basin
4. Statistical analysis of data on thickness and rate of regional sediment accumulation for major stratigraphic units, East Texas Basin
5. Volume of salt-withdrawal basins, East Texas Basin
6. Comparison of rates of salt-dome growth and methods used to calculate them
7. Overall and fastest bulk-strain rates in East Texas Basin salt diapir
Citation
Seni, S. J., and Jackson, M.P.A., 1984, Sedimentary Record of Cretaceous and Tertiary Salt Movement, East Texas Basin: Times, Rates, and Volumes of Salt Flow and Their Implications for Nuclear Waste Isolation and Petroleum Exploration: The University of Texas at Austin, Bureau of Economic Geology, Report of Investigations No. 139, 89 p.
