Reports of Investigations
-
Books & Reports
- Reports of Investigations
- Guidebooks
- Udden Series
- Geological Circulars
- Down To Earth
- Atlases of Major Oil and Gas Reservoirs
- Texas Memorial Museum Publications
- Environmental Geologic Atlas of the Texas Coastal Zone
- Mineral Resource Circulars
- Other Reports
- Seminars and Workshops
- Handbooks
- Submerged Lands of Texas
- Symposia
- Annual Reports
- Open File Reports
-
Maps & Cross Sections
- Thematic Maps
- Miscellaneous Maps, Charts & Sections
- Geologic Atlas of Texas
- STATEMAP Project Maps
- Geologic Quadrangle Maps
- Cross Sections
- Highway Geology Map
- Energy and Mineral Resource Maps
- Shoreline Change and Other Posters
- Wilcox Group, East Texas, Geological / Hydrological Folios
- Bouguer Gravity Atlas of Texas
- River Basin Regional Studies
- Featured Maps
- Posters
- Teachers & the Public
-
Geological Society Publications
- Gulf Coast Association of Geological Societies
- Alabama Geological Society
- Austin Geological Society
- Corpus Christi Geological Society
- Houston Geological Society
- Lafayette Geological Society
- Mississippi Geological Society
- New Orleans Geological Society
- South Texas Geological Society
- GCS SEPM Publications
- Historic BEG & UT Series
Geologic and Engineering Chracterization...Ford Geraldine Field, Bell Canyon Formation. Digital Download
RI0255D
For a print version: RI0255.
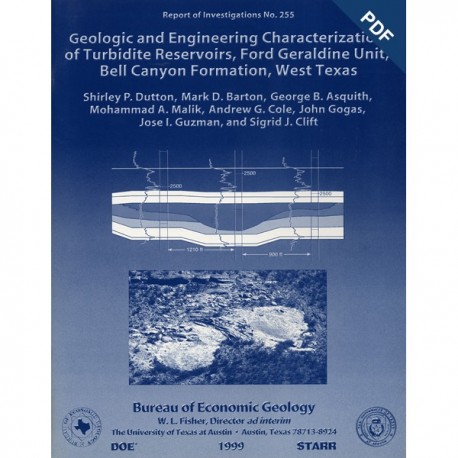
RI0255D. Geologic and Engineering Characterization of Turbidite Reservoirs, Ford Geraldine Unit, Bell Canyon Formation, West Texas, by S. P. Dutton, M. D. Barton, G. B. Asquith, M. A. Malik, A. G. Cole, John Gogas, J. I. Guzman, and S. J. Clift. 88 p., 74 figs., 7 tables, 1999. doi.org/10.23867/RI0255D. Downloadable PDF.
To purchase a copy of this publication in book format, please order RI0255.
About This Publication
This report summarizes results of an integrated geological, geophysical, petrophysical, and engineering study of a representative Delaware Mountain Group field to identify constraints on producibility in the deep-water sandstone reservoir exhibiting low primary recovery efficiency. The Ramsey sandstone interval of the Bell Canyon Formation was characterized in the Ford Geraldine unit, Culberson and Reeves Counties, Texas, using data from outcrops, subsurface logs and cores, and a 3-D seismic survey. Facies relationships determined from depositional processes interpreted from outcrop analogs exposed in Culberson County suggest that the sandstones were deposited by turbidites in a basin-floor system of channels and levees having attached lobes. The depositional model developed from outcrop can be widely applied by operators to other reservoirs that produce from Delaware sandstone. The study was funded primarily by the U.S. Department of Energy and the State of Texas.
ABSTRACT
Because reservoirs in deep-water sandstones of the Delaware Mountain Group in West Texas and New Mexico are characterized by low primary recovery efficiency (<I4 percent), an integrated geological, geophysical, petrophysical, and engineering study of a representative Delaware Mountain Group field was performed to identify constraints on producibility. Characterization of the Ramsey sandstone interval of the Bell Canyon Formation was conducted in the Ford Geraldine unit, Culberson and Reeves Counties, Texas, using data from outcrops, subsurface logs and cores, and a 3-D seismic survey.
Outcrop analogs exposed in Culberson County, Texas, were studied to interpret the depositional processes that formed the reservoirs at the Ford Geraldine unit better and to determine the dimensions of reservoir sandstone bodies. Facies relationships suggest that the sandstones were deposited by turbidites in a basin-floor system of channels and levees having attached lobes that initially prograded basinward, aggraded, and then turned around and stepped back toward the shelf.
The 0- to 60-ft-thick Ramsey sandstone interval in the Ford Geraldine unit is interpreted as a channel-levee and lobe system similar to the one described in outcrop. Lobe deposits consist of massive and convoluted sandstones having load and dewatering structures, suggesting that the sandstones were deposited rapidly from high-density turbidity currents. Channel facies, approximately 1,200 ft wide and 15 to 35 ft thick, overlie and locally incise the lobe deposits. They consist of massive and crossbedded sandstones interpreted to have been deposited from high-density turbidity currents. Channel margins, characterized by rippled and convoluted sandstones interbedded with siltstones, are interpreted as channel levees formed by overbanking of low-density turbidity currents. Ramsey sandstones are bounded by laterally continuous, organic-rich siltstones deposited by settling from suspension. Siltstone beds and extensively calcite cemented sandstones are the most important causes of reservoir complexity.
Petrophysical characterization of the Ford Geraldine unit was accomplished by integrating core and log data and quantifying petrophysical properties from wireline logs. Net-pay cutoffs of 215 percent porosity (for permeability of 1 md), 160 percent water saturation, and 515 percent volume of clay were established. Water saturations were calculated by the following modified Archie equation: S, = [(I/0) x (Rw/R,)]l'l.90. The petrophysical data were used to map porosity, permeability, net pay, water saturation, mobile oil saturation, and other reservoir properties. Interpretation of the 3-D seismic volume indicates that Ramsey sandstone thickness in the Ford Geraldine unit is one-fourth of a wavelength of the seismic data or less and is therefore considered a thin bed. The coherency cube was effective in delineating the field outline but failed to detect reservoir compartmentalization. A residual map of the seismic horizon corresponding to the top of the Lamar limestone identified a residual high that is associated with Ramsey sandstone thickness.
An area in the north part of the unit that has not undergone tertiary development was chosen for reservoir modeling/simulation. Flow simulations were performed for a CO, flood to estimate the tertiary recovery potential of the area. Results indicate that 10 to 30 percent (1 to 3 million barrels [MMbbl]) of the remaining oil in the area can be produced by CO, injection.
Keywords: Bell Canyon Formation, deep-water sandstones, Delaware Basin, reservoir characterization, turbidites
CONTENTS
ABSTRACT
INTRODUCTION
GEOLOGIC SETTING
Stratigraphic Framework
Delaware Sandstone Oil Play
OUTCROP CHARACTERIZATION OF BELL CANYON SANDSTONE RESERVOIR ANALOGS
Introduction
Models of Basinal Sandstone Deposition
Facies
Depositional Elements
Willow Mountain Case Study
Depositional Interpretation
Conclusions
RESERVOIR CHARACTERIZATION OF FORD GERALDINE UNIT
Ramsey Sandstone Facies
Mapping of Genetic Units
Upper Ford Siltstone
Ramsey 1 Sandstone
SH1 Siltstone
Ramsey 2 Sandstone
Lower Trap Siltstone
Distribution of Facies
Channel Facies
Levee Facies
Lobe Facies
Laminated Siltstone Facies
Lutite Facies
Proposed Depositional Model for Ford Geraldine Unit
Ramsey Sandstone Diagenesis
Methods
Petrography of Ramsey Sandstones
Diagenetic Controls on Reservoir Quality
PETROPHYSICS OF THE RAMSEY SANDSTONE
Porosity Transforms
Calculation of Water Saturation
True Formation Resistivity
Archie Parameters m and n
Net-Pay Cutoffs
Porosity Distribution
Permeability Distribution
Saturation Distribution
Net Pay
GEOPHYSICAL INTERPRETATION OF THE RAMSEY SANDSTONE
Design and Processing
Synthetic Seismograms and Wavelet Extraction
Structure, Amplitude, and Coherency Maps
Correlation Coefficients and Cross Plots
Conclusions
FIELD DEVELOPMENT HISTORY
Primary Recovery
Secondary Recovery
Tertiary Recovery
Reservoir Heterogeneity and Production Constraints
ESTIMATE OF TERTIARY RECOVERY POTENTIAL
Estimate of Tertiary Recovery from Production Data
Simulations of Tertiary Recovery
Simulation Results
Sensitivity Study
Improving Tertiary Recovery in the Stage 5 Area
CONCLUSIONS
ACKNOWLEDGMENTS
REFERENCES
Figures
1. Map showing location of the Ford Geraldine unit and outcrop study area in the Delaware Basin and paleogeographic setting during the Late Permian
2. Stratigraphic nomenclature of the Delaware Mountain Group in the Delaware Basin subsurface and outcrop areas and time-equivalent formations on the surrounding shelves
3. Production from the Geraldine Ford and other upper Bell Canyon fields in the Delaware Basin from the distal (southwest) ends of east-dipping, northeast-oriented linear trends of thick Ramsey sandstone deposits
4. Structure contours on the top of the Lamar limestone dip to the east and northeast
5. Typical log from the Ford Geraldine unit well no. 108
6. Map showing location of study area and outcrop exposure of Bell Canyon Formation
7. Sandstone-body architecture for turbidity-current model and saline-density-current model
8. Photograph of laminated siltstone, facies 3
9. Photograph of thin-bedded sandstones and siltstones, facies 4
10. Photograph of structureless sandstones, facies 5
11. Photograph showing deformed bedding contemporaneous with deposition, facies 5
12. Photograph of large-scale cross-lamination, facies 6
13. Photograph of climbing dunes, facies 6
14. Topographic map of Willow Mountain study area showing location of measured logs and cross sections
15. Cross section A-A' showing distribution of facies and traces of key surfaces within a single high-order cycle, Bell Canyon Formation
16. Cross section B-B' showing distribution of facies and traces of key surfaces within a single high-order cycle, Bell Canyon Formation
17. Cross section C-C' showing distribution of facies and traces of key surfaces within a single high-order cycle, Bell Canyon Formation
18. Photograph of channel-levee deposits and the same photograph with facies and surfaces labeled
19. Diagram illustrating depositional facies model for high-order cycle examined at Willow Mountain
20. Status of wells in the Ford Geraldine unit and distribution of core control
21. Laminated siltstone fining upward into organic-rich siltstone
22. Photograph of graded sandstone having floating clasts and overlying lutite
23. Photograph of sandstone having convoluted beds interpreted as loading and dewatering features at the base and massive sandstone above
24. Photograph of sandstone having flame structure, which is interpreted as a loading and dewatering feature
25. Photograph of climbing ripples in sandstone from well FGU-14, 2,728.2 to 2,729.1 ft
26. Photograph of cross-laminated sandstone from well FGU-130, 2,670.0 to 2,670.4 ft
27. Dip cross section D-D' down the length of the Ford Geraldine unit
28. Core description and porosity and permeability data from the Continental Oil Company G. E. Ramsey 18 No. 7 well
29. lsopach map of the upper Ford laminated siltstone, measured from the Ford condensed section to the top of the Ford
30. lsopach map of the Ramsey 1 sandstone, the main reservoir interval at Geraldine Ford field
31. lsopach map of the SHI laminated siltstone, which was deposited during a break in sandstone deposition
32. lsopach map of the Ramsey 2 sandstone
33. lsopach map of the lower Trap laminated siltstone, measured from the top of the Ramsey sandstone
34. Cross section E-E' through the north end of Ford Geraldine unit, where the SHI laminated siltstone separates the reservoir into Ramsey 1 and 2 sandstones
35. Cross section F-F' through the south part of Ford Geraldine unit, where only the Ramsey 1 sandstone is present
36. Cross section G-G' through the south part of Ford Geraldine unit, where only the Ramsey 1 sandstone is present
37. Distribution of porosity and permeability in channel, levee, and lobe facies
38. The main controls on porosity and permeability in the Ramsey sandstones are authigenic cements, particularly calcite, and, to a lesser extent, chlorite
39. Map of percentage of the Ramsey sandstone that is cemented by calcite
40. Vertical permeability profiles from core-analysis data for five wells in the Ford Geraldine unit
41. No significant difference exists in the porosity-versus-permeability relationship in channel, levee, and lobe facies
42. Capillary-pressure curves and calculated radii of pore throats for Ramsey sandstones
43. Flow chart of petrophysical analysis
44. Prewaterflood isosalinity map with formation water resistivities at 75°F for the Ford Geraldine unit
45. Cross plot of core porosity versus core permeability for the Ramsey sandstone in the Ford Geraldine unit, Reeves and Culberson Counties, Texas
46. Normalized relative permeability curves for the five curves measured in the FGU-156 well
47. Distribution of porosity in Ramsey sandstone from 4,900 core analyses
48. Map of average porosity for the Ramsey sandstone in the Ford Geraldine unit
49. Distribution of permeability in Ramsey sandstone from 4,900 core analyses
50. Map of geometric mean permeability for the Ramsey sandstone interval, calculated from porosity data from geophysical logs and the core-porosity-versus-core-permeability transform
51. Map of permeability x thickness for the Ramsey sandstone in the Ford Geraldine unit
52. Distribution of water saturation in Ramsey sandstone from 4,900 core analyses
53. Map of mobile oil saturation for the Ramsey sandstone in the Ford Geraldine unit
54. Map of net pay for the Ramsey sandstone in the Ford Geraldine unit
55. Outline of the area in which the 3-D seismic survey was acquired
56. Synthetic seismogram generated for the FGU-128 well to correlate the seismic reflection character with the formation tops interpreted from well logs
57. Representative seismic line showing the top of the Castile, Lamar, Ramsey, and Manzanita intervals
58. Residual map of the Lamar peak showing localized structural high and lows
59. Ramsey amplitude map on the Ramsey trough seismic marker
60. Coherence extraction on the top of the Lamar limestone, made by processing the seismic volume using the coherency-cube transform
61. Plots of total oil production in the Ford Geraldine unit and volumes of water and CO2 injected
62. Map of primary oil recovery for the Ramsey sandstone in the Ford Geraldine unit, Reeves and Culberson Counties, Texas
63. Map of secondary oil production resulting from the waterflood conducted from 1969 through 1980
64. Map of tertiary oil production through 1995 resulting from the CO2 flood that started in 1981
65. Map of total oil production from the Ford Geraldine unit through 1995
66. Map of the percentage of water produced during initial potential tests
67. Map of water cut at the end of primary production in 1969
68. Waterflooding of the Ford Geraldine unit, conducted in five stages, in the areas shown
69. Original oil in place in waterflood areas 1 through 5
70. Primary, secondary, primary + secondary, tertiary, and total recovery through December 1995 as a percentage of original oil in place in areas 1 through 5
71. Oil recovery as a fraction of remaining oil in place for stochastic and layered permeability cases
72. Surface oil rate in stock-tank barrels per day for stochastic and layered permeability cases
73. Surface water-oil ratio for stochastic and layered permeability cases
74. Surface gas-oil ratio for stochastic and layered permeability cases
Tables
1. Facies characteristics of Bell Canyon sandstones and siltstones
2. Characteristics of depositional elements in the Bell Canyon Formation
3. Mean porosity and permeability of upper Bell Canyon sandstones and siltstones and range of values
4. Design parameters for 3-D seismic acquisition
5. Highest correlation coefficients calculated from the data set of seismic attributes cross plotted with various rock properties
6. Highest correlation coefficients calculated from the data set of petrophysical parameters cross plotted with total oil recovery from Ford Geraldine unit wells through 1995
7. Fluid characteristics of reservoir
Citation
Dutton, S. P., Barton, M. D., Asquith, G. B., Malik, M. A., Cole, A. G., Gogas, John, Guzman, J. I., and Clift, S. J., 1999, Geologic and Engineering Characterization of Turbidite Reservoirs, Ford Geraldine Unit, Bell Canyon Formation, West Texas: The University of Texas at Austin, Bureau of Economic Geology, Report of Investigations No. 255, 88 p. doi.org/10.23867/RI0258D.
