Reports of Investigations
-
Books & Reports
- Reports of Investigations
- Guidebooks
- Udden Series
- Geological Circulars
- Down To Earth
- Atlases of Major Oil and Gas Reservoirs
- Texas Memorial Museum Publications
- Environmental Geologic Atlas of the Texas Coastal Zone
- Mineral Resource Circulars
- Other Reports
- Seminars and Workshops
- Handbooks
- Submerged Lands of Texas
- Symposia
- Annual Reports
- Open File Reports
-
Maps & Cross Sections
- Thematic Maps
- Miscellaneous Maps, Charts & Sections
- Geologic Atlas of Texas
- STATEMAP Project Maps
- Geologic Quadrangle Maps
- Cross Sections
- Highway Geology Map
- Energy and Mineral Resource Maps
- Shoreline Change and Other Posters
- Wilcox Group, East Texas, Geological / Hydrological Folios
- Bouguer Gravity Atlas of Texas
- River Basin Regional Studies
- Featured Maps
- Posters
- Teachers & the Public
-
Geological Society Publications
- Gulf Coast Association of Geological Societies
- Alabama Geological Society
- Austin Geological Society
- Corpus Christi Geological Society
- Houston Geological Society
- Lafayette Geological Society
- Mississippi Geological Society
- New Orleans Geological Society
- South Texas Geological Society
- GCS SEPM Publications
- Historic BEG & UT Series
The Application of a Coalbed Methane...Model in Defining Coalbed Methane. Digital Download
RI0244D
For a print version: RI0244.
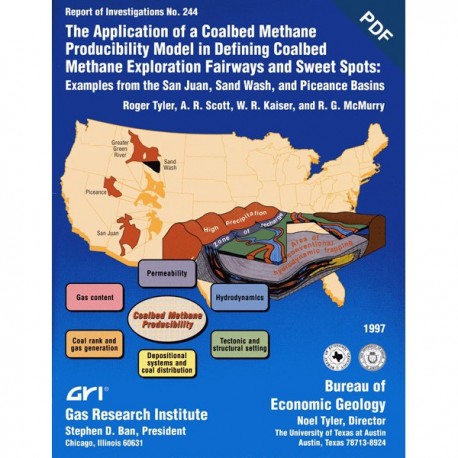
RI0244D. The Application of a Coalbed Methane Producibility Model in Defining Coalbed Methane Exploration Fairways and Sweet Spots: Examples from the San Juan, Sand Wash, and Piceance Basins, by Roger Tyler, A. R. Scott, W. R. Kaiser, and R. G. McMurry. 59 p., 37 figs., 1 table, 1997. doi.org/10.23867/RI0244D. Downloadable PDF.
To purchase this publication in book format, please order RI0244.
About This Publication
This report applies a basin-scale coalbed methane producibility model in defining fairways and sweet spots in three coal basins in the United States.
ABSTRACT
The Bureau of Economic Geology, The University of Texas at Austin, has developed a basin-scale coalbed methane producibility and exploration model based on a decade of Gas Research Institute-supported research performed in the San Juan, Sand Wash (Greater Green River), and Piceance Basins and on reconnaissance studies of several other producing and prospective coal basins in the United States. In this report we discuss the application of the producibility model in defining coalbed methane exploration fairways and sweet spots in coal basins in the United States. The producibility model also has direct application to worldwide coalbed methane exploration and development. The model indicates that tectonic and structural setting, depositional systems and coal distribution, coal rank, gas content, permeability, and hydrodynamics are controls critical to coalbed methane producibility. Simply knowing a basin's geologic and hydrologic characteristics will not lead to a conclusion about coalbed methane producibility, however, because it is the interplay among geologic and hydrologic controls on production and their spatial relation that governs producibility. High producibility requires that the geologic and hydrologic controls be synergistically combined. That synergism is evident in a comparison of the prolific producing San Juan Basin and marginally producing Sand Wash and Piceance Basins, where high productivity is governed by (1) thick, laterally continuous coals of high thermal maturity; (2) adequate permeability; (3) basinward flow of ground water through coals of high rank and gas content orthogonally toward no-flow boundaries (regional structural hingelines, fault systems, facies changes, permeability contrasts, and/or discharge areas); (4) generation of secondary biogenic gases; and (5) conventional and hydrodynamic trapping along those boundaries to provide additional gas beyond that generated during coalification. Understanding the dynamic interaction among these key geologic and hydrologic controls is the basis for delineation of exploration fairways in frontier basins and for targeting "sweet spots" in basins with established production.
Keywords: coalbed methane producibility model, exploration fairways and sweet spots, Piceance Basin, San Juan Basin, Sand Wash Basin
Contents
Abstract
Introduction
Coalbed Methane Producibility Model
Screening Multiple Basins for Coalbed Methane Potential
An Example of Selecting a Frontier Basin for Future Coalbed Methane Exploration and Development
Criteria for Multibasin Screening and Evaluation
An Example of a Multibasin Screening and Evaluation Exercise
Greater Green River Basin
Piceance Basin
Powder River Basin
Raton Basin
Multibasin Comparison
Geologic and Hydrologic Basin Analysis Used to Identify Controls on Coalbed Methane Producibility
San Juan Basin
Tectonic and Structural Setting
Depositional Setting and Coal Distribution
Coalification and Burial History
Hydrodynamics and Permeability
Gas Content
Sand Wash Basin
Tectonic and Structural Setting
Depositional Setting and Coal Distribution
Coalification and Burial History
Hydrodynamics and Permeability
Gas Content
Piceance Basin
Tectonic and Structural Setting
Depositional Setting and Coal Distribution
Coalification and Burial History
Hydrodynamics and Permeability
Gas Content
Application of the Producibility Model in Defining Exploration Fairways and Sweet Spots in the
San Juan. Sand Wash. and Piceance Basins
San Juan Basin
Sand Wash Basin
Piceance Basin
Conclusions
Acknowledgments
Conversion Chart
References
Figures
1. Coal basins and coalbed methane resources of the United States
2. Geologic and hydrologic controls on the producibility of coal gas
3. Basin comparison for coalbed methane model development
4. Sorption isotherms showing relation between gas content, pressure, and temperature
5. Conceptual model for high coalbed methane producibility
6. Coalbed methane exploration and development flow chart
7. Structure map (Huerfanito Bentonite) and face-cleat strikes, San Juan Basin
8. Fruitland net-coal map, San Juan Basin
9. Southwest-northeast stratigraphic cross section A-A' (D-20), from gamma-ray geophysical logs, San Juan Basin
10. Depositional model of Fruitland coal beds, San Juan Basin
11. Fruitland coal-rank map, San Juan Basin
12. Fruitland potentiometric-surface map and area of artesian overpressure, San Juan Basin
13. Coal stratigraphy of the Sand Wash Basin
14. Structure map, contoured on base of Williams Fork Formation, and face-cleat trends, Sand Wash Basin
15. Net-coal map, genetic unit 1, lower coal-bearing interval, Williams Fork Formation, Sand Wash Basin
16. Net-coal-thickness map of the lower coal-bearing unit, Fort Union Formation, Sand Wash Basin
17. Mesaverde coal-rank map, Sand Wash Basin
18. Upper Mesaverde potentiometric-surface map, Sand Wash Basin
19. Structure map contoured on top of the Rollins-Trout Creek Sandstone Members, Piceance Basin
20. Topographic map of the Piceance Basin
21. Face-cleat strikes and domains in the Mesaverde Croup and Wasatch Formation coal beds, Piceance Basin
22. Maximum horizontal stress orientations in the Piceance Basin area
23. Net-coal-thickness map of genetic units 1 through 3, Williams Fork Formation
24. Coal-rank map of the Cameo coal group from measured and calculated data
25. Schematic diagram showing importance of thrust faulting to regional hydrogeology
26. Williams Fork potentiometric-surface map, Piceance Basin
27. Vertical pressure gradients by study area
28. Pressure-elevation plots for study area 11 along the Divide Creek Anticline and study area 2 in White River field
29. Characteristics of key geologic and hydrologic controls. overlapping in the Rocky Mountain foreland basins, western United States
30. Geologic and hydrologic characterization of the Fruitland Formation, San Juan Basin
31. South-north cross-sectional view of ground-water flow, Fruitland-Pictured Cliffs and Tertiary aquifer systems, San Juan Basin
32. Fruitland pressure and temperature gradients and ground-water flow in the high-productivity fairway
33. Geologic and hydrologic characterization of the Williams Fork Formation, Sand Wash Basin
34. Southwest-northeast cross-sectional view C-C' of ground-water flow, Williams Fork Formation, Sand Wash Basin
35. Geologic and hydrologic characterization of the Williams Fork Formation, Piceance Basin
36. Northwest-southeast cross-sectional view B-B' of ground-water flow, Williams Fork Formation, Piceance Basin
37. Exploration target areas, Piceance Basin
Table
1. Summary of coalbed methane criteria critical to coal basin assessment
Citation
Tyler, Roger, Scott, A. R., Kaiser, W. R., and McMurry, R. G., 1997, The Application of a Coalbed Methane Producibility Model in Defining Coalbed Methane Exploration Fairways and Sweet Spots: Examples from the San Juan, Sand Wash, and Piceance Basins: The University of Texas at Austin, Bureau of Economic Geology, Report of Investigations No. 244, 59 p. doi.org/10.23867/RI0244D.
