Reports of Investigations
-
Books & Reports
- Reports of Investigations
- Guidebooks
- Udden Series
- Geological Circulars
- Down To Earth
- Atlases of Major Oil and Gas Reservoirs
- Texas Memorial Museum Publications
- Environmental Geologic Atlas of the Texas Coastal Zone
- Mineral Resource Circulars
- Other Reports
- Seminars and Workshops
- Handbooks
- Submerged Lands of Texas
- Symposia
- Annual Reports
- Open File Reports
-
Maps & Cross Sections
- Thematic Maps
- Miscellaneous Maps, Charts & Sections
- Geologic Atlas of Texas
- STATEMAP Project Maps
- Geologic Quadrangle Maps
- Cross Sections
- Highway Geology Map
- Energy and Mineral Resource Maps
- Shoreline Change and Other Posters
- Wilcox Group, East Texas, Geological / Hydrological Folios
- Bouguer Gravity Atlas of Texas
- River Basin Regional Studies
- Featured Maps
- Posters
- Teachers & the Public
-
Geological Society Publications
- Gulf Coast Association of Geological Societies
- Alabama Geological Society
- Austin Geological Society
- Corpus Christi Geological Society
- Houston Geological Society
- Lafayette Geological Society
- Mississippi Geological Society
- New Orleans Geological Society
- South Texas Geological Society
- GCS SEPM Publications
- Historic BEG & UT Series
Playas and Recharge of the Ogallala Aquifer on the Southern High Plains,Texas...Digital Download
RI0242D
For a print version: RI0242.
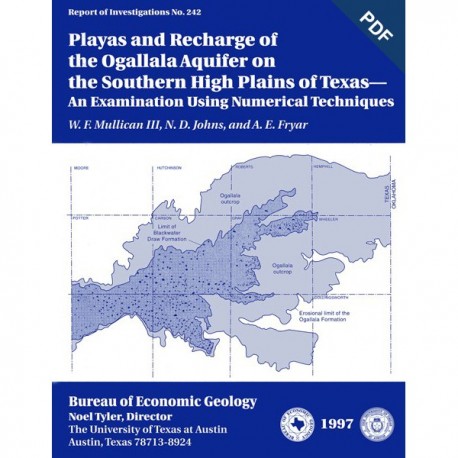
RI0242D. Playas and Recharge of the Ogallala Aquifer on the Southern High Plains of Texas--An Examination Using Numerical Techniques, by W. F. Mullican III, N. D. Johns, and A. E. Fryar. 72 p., 29 figs., 9 tables, 1997. doi.org/10.23867/RI0242D. Downloadable PDF.
To purchase this publication in book format, please order RI0242.
About This Publication
This study used a numerical model to examine the playa-focused recharge theory by comparing it with the spatially uniform approach and with a zonal approach.
ABSTRACT
Much recent hydrologic, geologic, and chemical evidence suggests that the approximately 19,250 seasonal lakes on the Southern High Plains of Texas and New Mexico, commonly known as playas, are the principal focal points of recharge to the Ogallala aquifer. As focal points of recharge, playas take on a new significance because of their capture of essentially all surface water drainage in the region and the consequent potential for introduction of contaminants to the Ogallala aquifer. In this study, we evaluate the hydrologic plausibility of this playa-focused recharge theory through construction of a finite-difference ground-water flow model that simulates a part of the Ogallala aquifer underlying 11 Texas counties on the Southern High Plains.
This study differs in scale and purpose from previous ground-water models of the Ogallala aquifer, which were typically regional-scale water resource evaluations. Because of their broad scale, earlier models adequately conceptualized recharge as a spatially uniform surface process applied at a single regional rate or varied only over very large geographic areas. However, because playas are small features, comparatively high recharge fluxes would have to occur through them to achieve recharge volumes typical of the spatially uniform approach. This study used a numerical model to examine the plausibility of the playa-focused recharge theory by comparing it with the spatially uniform approach and with a zonal approach wherein recharge rates were set on the basis of the geologic unit present at the surface.
Model development was initiated under the assumption of steady-state conditions before the significant ground-water withdrawals that started about 195%0 in the study area. Among the most important data to characterize this part of the Ogallala aquifer were the hydraulic conductivity data, which were derived from the available records of well tests. Initial steady-state simulations were used to calibrate boundary conditions, and the appropriate regional rate of recharge, and to adjust the hydraulic conductivity distribution. A geographic information system (GIS) was used to determine that playas constitute 2.74 percent of the surface area in the Blackwater Draw part of the study area and to translate individual playa locations and areas to the appropriate finite-difference cells of the model. Further steady-state modeling was then used to compare recharge scenarios.
The playa-focused recharge theory was further tested by using the calibrated model to perform transient simulations to evaluate the significant declines in water levels from 1960 to 1990. However, this effort was hampered by a lack of data regarding the number, placement, and withdrawal rates of the abundant uncataloged wells in the study area. Finally, a smaller part of the Ogallala aquifer and five playas at the U.S. Department of Energy's Pantex Plant, near Amarillo and near the center of the study area, were simulated to evaluate potential contaminant movement within the aquifer utilizing a particle-tracking procedure.
The results of the steady-state simulations established that the playa-focused recharge theory is entirelyplausible hydrologically. Quantitative comparisons of discrepancy between the model-simulated and the measured 1959-60 water-table surfaces under the playa-focused recharge scenario are as good as or better than those of the spatially uniform or zonal approaches. A recharge rate of 219 mmyr-l (8.62 inches yr-l) focused through playas across the Blackwater Draw part of the Southern High Plains and 9 rnrn yr-l (0.354 inch yr-l) for the Ogallala outcrop area yielded the best result. The playa-focused recharge rate of 219 mm yr-l (8.62 inches yr-1) is volumetrically equivalent to the zonal recharge rate of 6 rnrn yr-l (0.236 inch yr-l) for the entire Blackwater Draw Formation outcrop area. Furthermore, the transient simulations verified the playa-focused recharge theory by satisfactorily matching the significant declines in water levels over the 1960-90 period, especially those in the area of the City of Amarillo's Carson County Well Field (ACCWF).
Finally, the 1990 simulated water-table surface for the Pantex Plant area was used to evaluate potential contaminant movement within the Ogallala aquifer. The results of the particle-tracking procedure indicate that a particle entering the Ogallala aquifer would reach wells to the north and northeast of the Pantex Plant with a traveltime of several tens to hundreds of years.
Keywords: Blackwater Draw Formation, finite-difference model, focused recharge, Ogallala aquifer, Ogallala Formation, playa basins, Southern High Plains
CONTENTS
Abstract
Introduction
Nomenclature
Geologic and Geographic Setting
Previous Investigations
Methods
Predevelopment Steady-State Model
Aquifer Geometry
Hydraulic Conductivity
Lateral Boundary Conditions
Recharge
Transient Model
Time Periods
Initial Conditions and Withdrawals through Wells
Aquifer Storage Coefficient
Potential Contaminant Movement
Effective Porosity
Particle Placement
Results
Predevelopment Model
Transient Model
Potential Contaminant Movement
Discussion
Conclusions
Acknowledgments
References.
Appendix: Recharge to the Ogallala Aquifer--A Review
Figures
1. Location map showing the 11 counties in the study area and their relationship to the Southern High Plains of Texas
2. Geologic map of playas and the Quaternary Blackwater Draw and late Tertiary Ogallala Formations
3. Map of average annual precipitation in the study area
4. Finite-difference grid of the ground-water flow model constructed for this study
5. Structure map of the base of the Ogallala aquifer
6. Estimated saturated thickness of the Ogallala aquifer as of 1959-60
7. Distribution and values of hydraulic conductivity derived from specific capacity tests
8. Distribution of hydraulic conductivity values for wells producing from the Ogallala aquifer in Randall and extreme eastern Deaf Smith Counties
9. Hydraulic conductivity input data used for model simulations
10. Ogallala aquifer water-table surface map, 1990
11. Locations of wells with water-level measurements used in this study
12. Cross section showing measured and simulated water-table profiles (simulations A to E)
13. Simulation C water-table surface and measured 1959-60 water-table surface
14. Simulation D water-table surface and measured 1959-60 water-table surface
15. Simulation E water-table surface and measured 1959-60 water-table surface
16. Simulation F water-table surface and measured 1959-60 water-table surface
17. Cross section showing measured and simulated water-table profiles (simulations E to I)
18. Comparison of water-table surfaces of simulations F and H
19. Comparison of water-table surfaces of simulations F and I
20. Simulation J water-table surface and measured 1990 water-table surface
21. Locations of the 1,165 make-up wells used in simulation K
22. Simulation K water-table surface and measured 1990 water-table surface
23. Simulation M water-table surface and measured 1990 water-table surface
24. Simulation M water-table surface and measured 1990 water-table surface for the immediate vicinity of the Pantex Plant and the City of Amarillo's Carson County Well Field
25. Comparison of simulations M, N, and O
26. Empirical relationship between total and effective porosity based on textural distribution
27. Results from potential contaminant transport simulation
28. Traveltimes from origination points to Pantex Plant boundary or points of discharge
A-1. Response of selected wells in the Southern High Plains to recharge through nearby playas
Tables
-
Well test data and derived hydraulic conductivity values used in the model
-
Withdrawals from Amarillo’s Carson County Well Field
-
Withdrawals from the modeled part of the Ogallala aquifer from 1960 through 1990
-
Number of known wells in the modeled part of the Ogallala aquifer from 1960 through 1990
-
Default withdrawal rates for the known wells in the modeled part of the Ogallala aquifer from 1960 through 1990
-
Steady-state ground-water modeling results
-
Comparison of key transient model simulations for the entire model area
-
Comparison of key transient model simulation results in the area of the Pantex Plant and Amarillo’s Carson County Well Field
A-1. Published recharge values, Southern High Plains
Citation
Mullican, W. F. III., Johns, N. D., and Fryar, A. E., 1997, Playas and Recharge of the Ogallala Aquifer on the Southern High Plains of Texas--An Examination Using Numerical Techniques: The University of Texas at Austin, Bureau of Economic Geology, Report of Investigations No. 242, 72 p. doi.org/10.23867/RI0242D.
