Reports of Investigations
-
Books & Reports
- Reports of Investigations
- Guidebooks
- Udden Series
- Geological Circulars
- Down To Earth
- Atlases of Major Oil and Gas Reservoirs
- Texas Memorial Museum Publications
- Environmental Geologic Atlas of the Texas Coastal Zone
- Mineral Resource Circulars
- Other Reports
- Seminars and Workshops
- Handbooks
- Submerged Lands of Texas
- Symposia
- Annual Reports
- Open File Reports
-
Maps & Cross Sections
- Thematic Maps
- Miscellaneous Maps, Charts & Sections
- Geologic Atlas of Texas
- STATEMAP Project Maps
- Geologic Quadrangle Maps
- Cross Sections
- Highway Geology Map
- Energy and Mineral Resource Maps
- Shoreline Change and Other Posters
- Wilcox Group, East Texas, Geological / Hydrological Folios
- Bouguer Gravity Atlas of Texas
- River Basin Regional Studies
- Featured Maps
- Posters
- Teachers & the Public
-
Geological Society Publications
- Gulf Coast Association of Geological Societies
- Alabama Geological Society
- Austin Geological Society
- Corpus Christi Geological Society
- Houston Geological Society
- Lafayette Geological Society
- Mississippi Geological Society
- New Orleans Geological Society
- South Texas Geological Society
- GCS SEPM Publications
- Historic BEG & UT Series
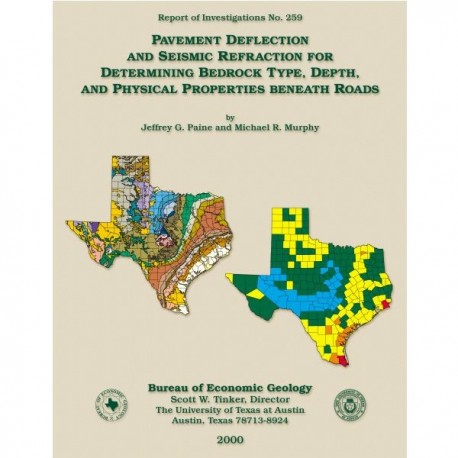
Pavement Deflection and Seismic Refraction for Determining Bedrock Type, Depth, and Physical Properties beneath Roads
RI0259
For a downloadable, digital version: RI0259D.
RI0259. Pavement Deflection and Seismic Refraction for Determining Bedrock Type, Depth, and Physical Properties beneath Roads, by J. G. Paine and M. R. Murphy. 53 p., 45 figs., 3 tables, 1 appendix, 2000. Print.
To purchase this publication as a downloadable PDF, please order RI0259D.
ABSTRACT
We examined the relationship between three data types--geologic maps, measurements of pavement deflection under load, and seismic refraction data--from diverse geologic settings in Texas to determine (1) whether geologic maps and seismic refraction data might be used to interpret deflections and assess pavement condition and (2) whether deflections and refraction data acquired on pavement might have geologic applications.
Engineers assess pavement condition by applying a known load to a road and measuring vertical pavement deflection using the Falling-Weight Deflectometer (FWD). Our comparisons of deflections with mapped geologic units in four physiographic regions of Texas revealed differences in FWD response that are related to differences in either bedrock depths or physical properties of geologic units that range from Precambrian to Holocene in age and that include many different sedimentary, igneous, and metamorphic rocks. At the FWD sensor most distant (1.8 m) from the load, deflections are greatest where roads are underlain by elastic sedimentary rocks (sandstones, mudstones, and shales) and unconsolidated alluvium. Lowest deflections are measured over stiffer limestones and igneous and metamorphic rocks.
Ratios calculated by dividing the deflections measured 0.3 m (W2 sensor) and 1.8 m (W7 sensor) from the load are better discriminators. These ratios are highest where pavement is underlain by rigid rock types such as granites, gneisses, and schists (ratios of 17:1 to 40:1), are intermediate where the underlying bedrock is limestone (10:1 to 27:1), and are lowest over sandstones, mudstones, and unconsolidated sediments (6:1 to 14:1). These results suggest that geologic maps are useful in FWD analysis and that FWD data alone might be used to predict rock type, allowing the FWD to be used in applications such as geologic mapping and sinkhole detection.
We employed the FWD and a modified soil-probe hammer as seismic refraction sources to determine whether the correlation between rock type and pavement deflections is caused by differing rock properties or bedrock depth. These tests revealed that the FWD is a viable seismic source and that refraction data can be acquired on pavement. The refraction experiments and the rock type-deflection relationship show that (1) pavement deflections can help the geologist make geologic maps, (2) geologic maps can help the engineer interpret pavement deflections, and (3)seismic refraction measurements can assist both geologist and engineer in determining bedrock depths, rock properties, and rock types.
Keywords: bedrock, Falling-Weight Deflectometer, geologic mapping, pavement deflection, rock properties, seismic refraction
CONTENTS
ABSTRACT
INTRODUCTION
Physiographic Regions and Bedrock Types
Importance of Depth to Bedrock on Deflection and Moduli Estimates
Limitations of Estimating Rigid-Layer Depth from FWD Data Alone
METHODS
Bedrock Type and FWD Response
Seismic Refraction
RELATIONSHIP BETWEEN BEDROCK TYPE AND FWD RESPONSE
North-Central Plains Site
Site A: Texas 16, Archer and Young Counties
Central Texas Uplift Sites
Site B: Texas 16, Llano and Gillespie Counties
Site C: Texas 71, Burnet County
Edwards Plateau Site
Site D: U.S. 290, Blanco and Hays Counties
Gulf Coastal Plains Sites
Site E: Texas 71, Bastrop County
Site F: Texas 16, Jim Hogg and Zapata Counties
Rock-Type Response
BEDROCK DEPTHS FROM SEISMIC REFRACTION
Pickle Research Campus Site
Refraction Experiment PRC SPH 1
Refraction Experiment PRC SPH2
Interpreted Strata
Jacksboro Site
Effect of Digital Filtering
Refraction Analysis
Interpreted Strata
DISCUSSION
POTENTIAL APPLICATIONS
CONCLUSIONS
ACKNOWLEDGMENTS
REFERENCES
APPENDIX A. Age, lithology, constituents, and thickness of geologic units
Figures
1. Falling-Weight Deflectometer with detectors deployed on pavement
2. Average roadway deflection by county measured at Falling-Weight Deflectometer detector W7
3. Simplified geologic map of Texas
4. Physiographic regions of Texas
5. Soil-probe hammer and recording spread of spike-mounted geophones on the shoulder of Road D at the J. J. Pickle Research Campus, The University of Texas at Austin
6. Map of seismic refraction test site at PRC
7. Geophones mounted on steel plates and placed on the pavement of southbound U.S. 281, south of Jacksboro, Texas
8. Map of the Jacksboro seismic refraction test site
9. North-south cross section, showing geologic units, elevation, and W1 through W7 deflection along Texas 16 between reference mile markers 220 and 264, Archer and Young Counties, North Texas
10. Average and individual deflections for rock types mapped along Texas 16 in Archer and Young Counties
11. Average deflections for all rock units mapped along Texas 16 in Archer and Young Counties
12. Average W7 deflection and W2:W7 deflection ratio by rock type along Texas 16, Archer and Young Counties
13. North-south cross section, showing geologic units, elevation, and W1 through W7 deflection along Texas 16 between reference mile markers 450 and 490, Llano and Gillespie Counties, Central Texas
14. Average and individual deflections for rock types mapped along Texas 16 in Llano and Gillespie Counties
15. Average deflections for all rock units mapped along Texas 16 in Llano and Gillespie Counties
16. Average W7 deflection and W2:W7 deflection ratio by rock type along Texas 16, Llano and Gillespie Counties
17. West-east cross section, showing geologic units, elevation, and W1 through W7 deflection along Texas 71 between reference mile markers 528 and 542, Burnet County, Central Texas
18. Average and individual deflections for rock types mapped along Texas 71 in Burnet County
19. Average deflections for all rock units mapped along Texas 71 in Burnet County
20. Average W7 deflection and W2:W7 deflection ratio by rock type along Texas 71, Burnet County
21. West-east cross section, showing geologic units, elevation, and W1 through W7 deflection along U.S. 290 between reference markers 536 and 563, Blanco and Hays Counties, Central Texas
22. Average and individual deflections for rock types mapped along U.S. 290 in Blanco and Hays Counties
23. Average deflections for all rock units mapped along U.S. 290 in Blanco and Hays Counties
24. Average W7 deflection and W2:W7 deflection ratio by rock type along U.S. 290, Blanco and Hays Counties
25. West-east cross sections, showing geologic units, elevation, and W1 through W7 deflection along Texas 71 between reference mile markers 590 and 598, Bastrop County, southeast Texas
26. Average and individual deflections for rock types mapped along Texas 71 in Bastrop County
27. Average deflections for all rock units mapped along Texas 71 in Bastrop County
28. Average W7 deflection and W2:W7 deflection ratio by rock type along Texas 71, Bastrop County
29. North-south cross section, showing geologic units, elevation, and W1 through W7 deflection along Texas 16 between reference mile markers 758 and 804, Jim Hogg and Zapata Counties, South Texas
30. Average and individual deflections for rock types mapped along Texas 16 in Jim Hogg and Zapata Counties
31. Average deflections for all rock units mapped along Texas 16 in Jim Hogg and Zapata Counties.
32. Average W7 deflection and W2:W7 deflection ratio by rock type along Texas 16, Llano and Gillespie Counties
33. Composite W7 deflection and W2:W7 deflection ratio for individual rock types mapped along Texas 16, U.S. 290, and Texas 71 test sites
34. Seismic response recorded by a 48-geophone recording spread with the FWD as a seismic source
35. Field records from refraction test PRC SPHl acquired by using a soil-probe hammer as a seismic source
36. First-arrival times for refraction test PRC SPHl for forward- and reverse propagating waves
37. Apparent velocity and zero-offset time for forward data from refraction test PRC SPH1
38. Apparent velocity and zero-offset time for reverse data from refraction test PRC SPH1
39. Calculated layer velocities and thicknesses and apparent dips of layer interfaces for refraction tests PRC SPH 1, PRC SPH2, and Jacksboro SPH1
40. Field records from refraction test PRC SPH2 acquired by using a soil-probe hammer as a seismic source
41. Effect of digital filtering and amplification on a field record from the Jacksboro site acquired by using a soil-probe hammer as a seismic source, with neither digital filtering nor time-varying gain, time-varying gain but no digital filtering, 125-Hz low-cut filter without time-varying gain, and 125-Hz low-cut filter and time-varying gain applied
42. Field records from the Jacksboro site acquired by using a soil-probe hammer as a seismic source
43. First-arrival times for the Jacksboro site for forward- and reverse-propagating waves
44. Apparent velocity and zero-offset time for forward refraction data from the Jacksboro site
45. Apparent velocity and zero-offset time for reverse refraction data from the Jacksboro site
Tables
1.Principal physiographic regions of Texas
2. Deflection statistics for sites A through F
3. Summary of refraction data collected at the Pickle Research Campus and Jacksboro sites
Citation
Paine, J. G., and Murphy, M. R., 2000, Pavement Deflection and Seismic Refraction for Determining Bedrock Type, Depth, and Physical Properties beneath Roads: The University of Texas at Austin, Bureau of Economic Geology, Report of Investigations No. 259, 53 p.
