Reports of Investigations
-
Books & Reports
- Reports of Investigations
- Guidebooks
- Udden Series
- Geological Circulars
- Down To Earth
- Atlases of Major Oil and Gas Reservoirs
- Texas Memorial Museum Publications
- Environmental Geologic Atlas of the Texas Coastal Zone
- Mineral Resource Circulars
- Other Reports
- Seminars and Workshops
- Handbooks
- Submerged Lands of Texas
- Symposia
- Annual Reports
- Open File Reports
-
Maps & Cross Sections
- Thematic Maps
- Miscellaneous Maps, Charts & Sections
- Geologic Atlas of Texas
- STATEMAP Project Maps
- Geologic Quadrangle Maps
- Cross Sections
- Highway Geology Map
- Energy and Mineral Resource Maps
- Shoreline Change and Other Posters
- Wilcox Group, East Texas, Geological / Hydrological Folios
- Bouguer Gravity Atlas of Texas
- River Basin Regional Studies
- Featured Maps
- Posters
- Teachers & the Public
-
Geological Society Publications
- Gulf Coast Association of Geological Societies
- Alabama Geological Society
- Austin Geological Society
- Corpus Christi Geological Society
- Houston Geological Society
- Lafayette Geological Society
- Mississippi Geological Society
- New Orleans Geological Society
- South Texas Geological Society
- GCS SEPM Publications
- Historic BEG & UT Series
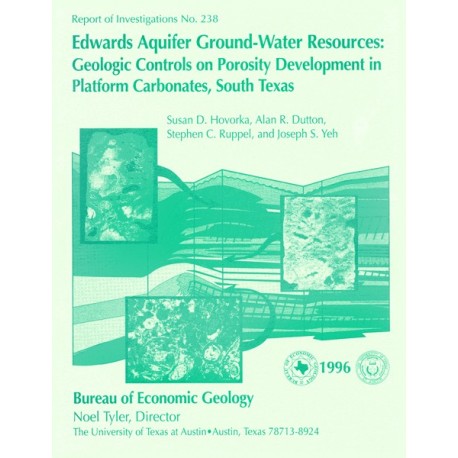
Edwards Aquifer Ground-Water Resources: Geologic Controls on Porosity Development in Platform Carbonates, South Texas
RI0238
For a downloadable, digital version: RI0238D.
RI0238. Edwards Aquifer Ground-Water Resources: Geologic Controls on Porosity Development in Platform Carbonates, South Texas, by S. D. Hovorka, A. R. Dutton, S. C. Ruppel, and J. S. Yeh. 75 p., 39 figs., 1996. Print.
To purchase this publication as a downloadable PDF, please order RI0238D.
About This Publication
Focusing on the highly developed Edwards aquifer, which supplies water for a large area of south-central Texas, this report presents a three-dimensional model of the porosity distribution in the aquifer, which quantifies the spatial distribution of water resources and provides information that can be used in ground-water flow and transport models. The study provides a detailed assessment of the amount of water in the Edwards aquifer as of 1996 on the basis of a large data set and a reproducible methodology.
ABSTRACT
The Edwards aquifer of south-central Texas is a prolific but heavily developed water resource. Amount and distribution of water in the aquifer are related to development of porosity in highly heterogeneous, complexly altered, platformal to shallow basinal carbonate rocks of the Cretaceous Edwards Group. Uplift and faulting of the Edwards Group along the Balcones Fault System have contributed to the geologic complexity of the aquifer.
We assessed distribution of water in the Edwards aquifer by means of a core- and log-based stratigraphic study that included 200 neutron and resistivity logs and 300 porosity and permeability plug analyses. Resource evaluation utilized Stratamodel Stratigraphic Geocellular Modeling software to interpolate and quantify log data throughout the region. Calculated average porosity of the Edwards aquifer is 18 percent. Estimated total waterfilled pore volume of the Edwards aquifer within the study area is 173 million acre-feet. Only 3 percent of this total water lies in the traditionally used part of the aquifer between the highest and lowest recorded water levels.
Spatial distribution of water in the aquifer is strongly related to the geologic factors involved in porosity development. Depositional fabric, Cretaceous diagenesis, and late diagenesis during development of the fresh-water aquifer are the major geologic contributors.
High-frequency subtidal-supratidal cycles, the fundamental depositional unit in San Marcos platformal facies of the Edwards Group, exerted a strong influence on porosity evolution in the east part of the study area. Two relative-sea-level-controlled sequences corresponding to the Kainer and Person Formations are defined by cycle stacking patterns. Edwards Group rocks in the Maverick Basin, also cyclic but entirely subtidal, have lower average porosity than the platformal facies.
Vertical facies stacking influences the amount of diagenetic modification of porosity. Dolomitized subtidal facies beneath stacked tidal-flat cycles have extremely high porosity (as much as 45 percent) because of dolomite dissolution. Calcite cements derived from evaporite diagenesis and resulting from marine flooding occlude porosity in grainstones. A high-porosity area that shows the influence of the hydrologic setting is found in southern Medina and southwestern Bexar Counties on both sides of the fresh-water-saline interface known as the bad-water line.
The quantitative, three-dimensional model of the porosity distribution in the aquifer presented in this study quantifies the spatial distribution of water resources and provides information that can be used in ground-water flow and transport models. Additional studies built upon the data set collected for the porosity study have been used to better quantify the permeability structure of the aquifer for input into numerical hydrologic models. Future numerical hydrologic models are the tool needed to better understand and predict aquifer responses to situations of public interest such as the changes in recharge rate, water levels, pumpage, and spring flow.
Keywords: carbonate diagenesis, Edwards aquifer, karst, South Texas
CONTENTS
Abstract
Introduction
Geologic Setting
Methods
Core Description
Stratigraphic Model Development
Log Acquisition
Log Calculation of Porosity
Measurement of Porosity in Core
Neutron-Log Calibration of Cored Wells
Porosity Calculation Using Resistivity Logs
Porosity Calculation from Unscaled Logs
Aquifer Model Construction
Stratigraphic Model
Facies and Depositional Environments
Subtidal Platform Facies
Tidal-Flat and Supratidal Facies
Basinal Facies of the Maverick Basin
West Nueces Formation
McKnight Formation
Cycle Types of the San Marcos Platform and Devils River Trend
Subtidal Low-Energy Cycles
Subtidal Low- to High-Energy Cycles
Subtidal Low-Energy to Intertidal/SupratidaI Cycles
Subtidal High-Energy to Intertidal/SupratidaI Cycles
Hypersaline Cycles
Cycle Types in the Maverick Basin
Cycle Stacking Patterns
Regional Correlations
Porosity Development
Intergranular Porosity in Grainstone
Intercrystalline Porosity in Dolostone
Solution-Enhanced Intergranular/lntercrystalIine Porosity
Fracture- and Solution-Enhanced Fracture Porosity
Cavernous Porosity
Porosity in Breccia
Porosity Calculation
Porosity Distribution
Discussion
Conclusions
Acknowledgments
References
Appendices
1. Well data base
2. Plug porosity and permeability measured in this study
Figures
1. Cretaceous stratigraphy of Central and South Texas
2. Paleogeographic setting of Edwards aquifer study area
3. Albian paleogeography within Edwards aquifer study area
4. Geologic setting of the Edwards aquifer
5. Log calibration curves
6. Specific conductance map used to estimate Rwa in resistivity-log porosity calculations
7. Cumulative frequency plots of representative calibrated neutron-porosity logs and all plug data collected for the study
8. Log calibration curves: cross plot of core-plug porosity against porosity calculated from neutron and resistivity logs and neutron-log porosity plotted against resistivity-log porosity
9. Normal-marine subtidal wackestone and packstone facies
10. Typical subtidal grainstone facies
11. Subtidal evaporites
12. Representative Edwards Group tidal-flat facies
13. Representative subtidal facies of the West Nueces Formation
14. Representative Edwards Group Maverick Basin facies
15. Detailed core descriptions from lower part of the Devils River Formation, USGS Sabinal core, Uvalde County
16. Detailed core descriptions of the upper Kainer and lower Person Formations, USGS Randolph FM 1604 core, Bexar County
17. Detailed core descriptions from lower Devils River Formation, TWDB TD-3 core, Medina County
18. Detailed core descriptions from lower Devils River Formation, TWDB TD-3 core, Medina County
19. Detailed core descriptions from upper and middle McKnight Formation, IBWC ID 22 core, Val Verde County
20. West-east cross section A-A', showing facies distribution and the stacking and lateral relationships between high- and intermediate-frequency cycles in the Edwards Group
21. High- and intermediate-frequency cycle stacking patterns on the San Marcos Platform and in the Maverick Basin
22. Detailed core descriptions from upper Person Formation, USGS Castle Hills core, Bexar County
23. West-east gamma-ray-neutron-resistivity log cross section A'-A", showing representative logs and informal stratigraphic units that were identified regionally
24. West-to-east facies interpretive facies cross section A-A" through Edwards Group, showing relationship between intermediate-frequency cycles and dolomitization
25. lsopach maps of the Edwards Group and upper Edwards Group
26. Variations in grainstone porosity
27. Altered porosity in grainstone associated with gypsum
28. Diagenetic modification of porosity during dolomitization
29. Porosity produced by dolomite dissolution in meteoric water
30. Porosity produced by fracturing
31. Diagenetic modification of porosity by karst
32. Missing core, corresponding to intervals of high porosity
33. Comparison of calculated porosity and measured porosity, USGS Castle Hills core
34. North-south porosity cross section B-B', Bexar County
35. North-south porosity cross section C-C', Medina County
36. West-east porosity cross section D-D' along length of aquifer
37. Average porosity in lower part of Edwards aquifer
38. Average porosity in upper part of Edwards aquifer
39. Estimated total Edwards pore volume in porosity times feet, showing amount of water within aquifer
Citation
Hovorka, S. D., Dutton, A. R., Ruppel, S. C., and Yeh, J. S., 1996, Edwards Aquifer Ground-Water Resources: Geologic Controls on Porosity Development in Platform Carbonates, South Texas: The University of Texas at Austin, Bureau of Economic Geology, Report of Investigations No. 238, 75 p.
