Reports of Investigations
-
Books & Reports
- Reports of Investigations
- Guidebooks
- Udden Series
- Geological Circulars
- Down To Earth
- Atlases of Major Oil and Gas Reservoirs
- Texas Memorial Museum Publications
- Environmental Geologic Atlas of the Texas Coastal Zone
- Mineral Resource Circulars
- Other Reports
- Seminars and Workshops
- Handbooks
- Submerged Lands of Texas
- Symposia
- Annual Reports
- Open File Reports
-
Maps & Cross Sections
- Thematic Maps
- Miscellaneous Maps, Charts & Sections
- Geologic Atlas of Texas
- STATEMAP Project Maps
- Geologic Quadrangle Maps
- Cross Sections
- Highway Geology Map
- Energy and Mineral Resource Maps
- Shoreline Change and Other Posters
- Wilcox Group, East Texas, Geological / Hydrological Folios
- Bouguer Gravity Atlas of Texas
- River Basin Regional Studies
- Featured Maps
- Posters
- Teachers & the Public
-
Geological Society Publications
- Gulf Coast Association of Geological Societies
- Alabama Geological Society
- Austin Geological Society
- Corpus Christi Geological Society
- Houston Geological Society
- Lafayette Geological Society
- Mississippi Geological Society
- New Orleans Geological Society
- South Texas Geological Society
- GCS SEPM Publications
- Historic BEG & UT Series
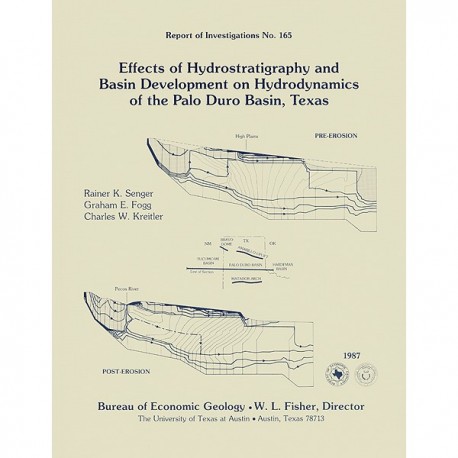
Effects of Hydrostratigraphy and Basin Development on Hydrodynamics of the Palo Duro Basin, Texas
RI0165
For a downloadable, digital version: RI0165D.
RI0165. Effects of Hydrostratigraphy and Basin Development on Hydrodynamics of the Palo Duro Basin, Texas, by R. K. Senger, G. E. Fogg, and C. W. Kreitler. 48 p., 30 figs., 5 tables, 2 appendices, 1987. ISSN: 0082335X: Print.
To purchase this publication as a downloadable PDF, please order RI0165D.
ABSTRACT
Deep brine aquifers of the Palo Duro Basin, Texas Panhandle, ranging in depth from about 1,000 to 3,000 m below land surface, are underpressured compared with the shallow Ogallala aquifer. Two-dimensional simulations of flow in an east-west regional cross-sectional model through the basin permitted us to characterize regional ground-water flow, to investigate causes of underpressuring below the Evaporite aquitard, and to evaluate mechanisms of recharge and discharge to and from the Deep-Basin Brine aquifer. Employing steady-state flow simulations, we investigated various effects of lithostratigraphy and topography on groundwater flow. We also used transient flow simulations to illustrate changes in regional hydrodynamics caused by different tectonic and geomorphologic processes.
The regional ground-water flow regime in the Palo Duro Basin consists of a shallow ground-water flow system governed primarily by topography and a deeper flow system recharging in the New Mexico area and passing deep beneath the Pecos River into the deep section of the Palo Duro Basin. The low-permeability Evaporite aquitard limits flow between the shallow and deep systems, although leakage through the aquitard is important on a regional scale and could contribute a significant part of the water in the deep system. The ground-water flow pattern within the Deep-Basin Brine aquifer is strongly controlled by the spatial distribution of more permeable strata such as granite-wash deposits, which drain the deep aquifer system more easily than it is recharged.
Repeated simulations with the model demonstrate that chief causes of underpressuring are regional topography and geology. Specifically, the Ogallala water table is relatively high owing to the elevation of the High Plains, the potentiometric surface of the Deep-Basin Brine aquifer is relatively low owing to the draining effect of permeable granite wash and very low recharge rates, and the low-permeability Evaporite aquitard effectively segregates the two aquifer systems, thereby maintaining the large head differential. The Pecos River valley serves as a discharge area for some ground water from the west that would otherwise move downdip into the deep aquifer; thus, capture of recharge water enhances underpressuring in the deep system beneath the western half of the High Plains.
Simulations of the hydrodynamic development of the Palo Duro Basin as a result of successive tectonic and geomorphologic events indicate that Cenozoic uplift and tilting of the basin (10 to 15 mya) caused considerable increase in ground water flow rates. The timing of the erosional events implies that significant underpressuring (hydraulic-head difference between shallow and deep aquifers in excess of 175 m) occurred within the last 1 to 2 m.y. as a result of the erosional retreat of the Eastern Caprock Escarpment. The drastic change in hydraulic heads during that period suggests a significant effect on the overall ground-water flow pattern in the deep section within the last 1 to 2 m.y. Modeling also indicates that erosional unloading associated with the retreat of the Eastern Caprock Escarpment was ineffective in creating large-scale underpressuring in the Deep-Basin Brine aquifer. Only in the vicinity of the escarpment is it possible that erosional unloading and the resulting expansion of the underlying aquitard could create subhydrostatic conditions within the aquitard. Similarly, hydrocarbon production along the margins of the basin and the concomitant reduction in reservoir pressure affect hydraulic heads only locally and do not influence regional ground-water flow in the Deep-Basin Brine aquifer.
Keywords: ground-water modeling, basin hydrodynamics, regional underpressuring, geologic processes, hydrogeology, Evaporite aquitard, Palo Duro Basin, Texas Panhandle, TExas
CONTENTS
Abstract
Introduction
Scope
Hydrogeology
Geologic setting
Physiography and climate
Recharge and discharge
Mechanisms of Underpressuring
Data Base
Hydraulic head and pressure
Hydrologic properties
Ogallala Formation
Dockum Group
Permian evaporite strata
San Andres unit 4 carbonate
Lower Permian and Pennsylvanian strata
Salt-dissolution zones
Specific storage
Computer Programs
Modeling Procedure
Finite element mesh
Boundary conditions
Limitations of the Model
Simulation Strategy: Steady-State Model
Results and Discussion
Granite-wash permeability
Simulation A-1
Simulation A-2
Simulation A-3
Role of the Evaporite aquitard
Simulation B-1
Simulation B-2
Simulation B-3
Interconnection of Ogallala and Dockum aquifers
Simulation C
Effect of the Pecos River
Simulation D
Ground-water flow rates and travel times
Simulation Strategy: Transient Model
Results and Discussion
Simulation of hydrodynamic development of the basin
Pre-uplift conditions
Basin uplift and tilting
Deposition of the Ogallala Formation
Erosion of the Pecos River
Erosion of the Eastern Caprock Escarpment
Effect of erosional unloading
Effect of hydrocarbon production
Summary and Conclusions
Acknowledgments
References
Appendix A. Effect of node-spacing differences in horizontal and vertical direction on the hydraulic-head solution
Appendix B. Simulating the effect of erosional unloading
FIGURES
1. Structural features of the Texas Panhandle and adjacent areas
2. Regional east-west cross section illustrating spatial relationships of the major depositional systems in the Palo Duro Basin
3. Fluid-pressure changes as a result of (a) epeirogenetic movement and (b) erosion and deposition
4. Fluid·pressure changes as a result of erosional unloading with pore·volume expansion of shale
5. Plot of pressure·depth drill-stem·test data from selected wells in the Deep·Basin Brine aquifer using high-quality class A data
6. Potentiometric-surface map of the Ogallala aquifer on the High Plains
7. Potentiometric-surface map of the Deep-Basin Brine aquifer constructed from kriged estimates of fresh-water hydraulic head
8. Difference between fresh·water hydraulic heads in the Ogallala and Deep-Basin Brine aquifers
9. Finite element mesh representing the major hydrologic units
10. Pressure-depth data from the Deep-Basin Brine aquifer, Jackson County, Oklahoma
11. Flow net from Simulation A-1 using hydraulic conductivities from table 4
12. Flow net from Simulation A-2 with increased permeability of proximal granite wash
13. lsolith map of Pennsylvanian and Permian (Wolfcampian) granite wash in the Texas Panhandle
14. Flow net from Simulation A-3 with increased hydraulic conductivities for granite wash compared with Simulation A-2
15. Flow net from Simulation-1 with increased vertical permeability of the Evaporite aquitard
16. Flow net from Simulation B·2 indicating a relatively small decrease in hydraulic heads in the deep section
17. Flow net from Simulation B-3 with decreased vertical permeability of the Evaporite aquitard
18. Flow net from Simulation C accounting for decreased vertical permeability within the shallow aquifer system
19. Flow net from Simulation D with modified finite element mesh
20. Hydraulic·head distribution from Simulation T-1 using hydraulic conductivities from table 2
21. Hydraulic-head distribution from Simulation T-2 representing hydrodynamic conditions 10 m.y. after the beginning of uplift
22. Flow net from the steady·state simulation equivalent to Simulation T-2
23. Hydraulic·head distribution from Simulation T-3 representing hydrodynamic conditions 10 m.y. after the beginning of Ogallala deposition
24. Hydraulic-head distribution from Simulation T-4 representing hydrodynamic conditions 5 m.y. after the onset of Pecos River valley erosion
25. Difference in hydraulic heads before and after Pecos River valley erosion
26. Hydraulic-head distribution from Simulation T-5 representing hydrodynamic conditions 1 m.y. after the gradual retreat of the Eastern Caprock Escarpment
27. Difference in hydraulic heads before and after escarpment retreat
28. Hydraulic·head distribution from Simulation P-1 showing possible effects of erosional unloading conditions 800,000 yr after gradual retreat of the Eastern Caprock Escarpment
29. Interval transit times of two mudstone marker beds near the Eastern Caprock Escarpment
30. Hydraulic-head distribution from Simulation H·1 showing effects of local hydrocarbon production in the lower Permian strata 100 yr after production began
TABLES
1. Generalized stratigraphic column of the Palo Duro Basin
2. Permeability of individual hydrogeologic units of Permian, Pennsylvanian, and pre-Pennsylvanian strata, Palo Duro Basin
3. Summary of steady-state simulations of the cross-sectional ground-water flow model
4. Assigned hydraulic-conductivity values for the major hydrologic systems
5. Summary of transient simulations representing the different tectonic and geomorphologic events
APPENDIX FIGURES
A1. Simplified model to test the effect of node-spacing differences in horizontal and vertical directions
A2. Diagram showing the differences in computed hydraulic heads at the corresponding node locations with respect to the 4-element case
B1. One-dimensional finite element model representing a uniform aquitard 800 m thick
B2. Comparison of analytical and numerical solutions for the effect of erosional unloading in an aquitard
APPENDIX TABLE
A1. Performance of the model at different conductance ratios
Citation
Senger, R. K., Fogg, G. E., and Kreitler, C. W., 1987, Effects of Hydrostratigraphy and Basin Development on Hydrodynamics of the Palo Duro Basin, Texas: The University of Texas at Austin, Bureau of Economic Geology, Report of Investigations No. 165, 48 p.
