Reports of Investigations
-
Books & Reports
- Reports of Investigations
- Guidebooks
- Udden Series
- Geological Circulars
- Down To Earth
- Atlases of Major Oil and Gas Reservoirs
- Texas Memorial Museum Publications
- Environmental Geologic Atlas of the Texas Coastal Zone
- Mineral Resource Circulars
- Other Reports
- Seminars and Workshops
- Handbooks
- Submerged Lands of Texas
- Symposia
- Annual Reports
- Open File Reports
-
Maps & Cross Sections
- Thematic Maps
- Miscellaneous Maps, Charts & Sections
- Geologic Atlas of Texas
- STATEMAP Project Maps
- Geologic Quadrangle Maps
- Cross Sections
- Highway Geology Map
- Energy and Mineral Resource Maps
- Shoreline Change and Other Posters
- Wilcox Group, East Texas, Geological / Hydrological Folios
- Bouguer Gravity Atlas of Texas
- River Basin Regional Studies
- Featured Maps
- Posters
- Teachers & the Public
-
Geological Society Publications
- Gulf Coast Association of Geological Societies
- Alabama Geological Society
- Austin Geological Society
- Corpus Christi Geological Society
- Houston Geological Society
- Lafayette Geological Society
- Mississippi Geological Society
- New Orleans Geological Society
- South Texas Geological Society
- GCS SEPM Publications
- Historic BEG & UT Series
Atoka Group (Lower-Middle Pennsylvanian), Northern Fort Worth Basin, Texas: Terrigenous Depositional Systems
RI0125
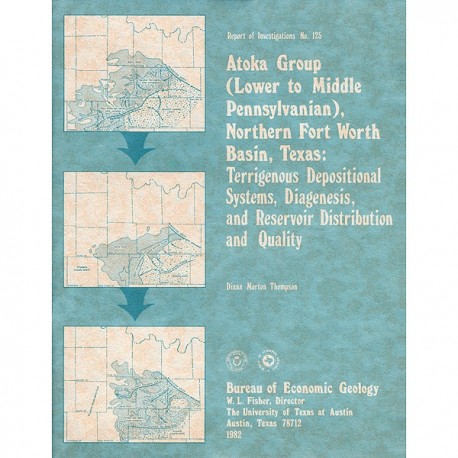
Atoka Group (Lower-Middle Pennsylvanian), Northern Fort Worth Basin Texas: Terrigenous Depositional Systems, Diagenesis, and Reservoir Distribution and Quality, by D. M. Thompson. 62 p., 27 figs., 5 tables, 19 plates, 1982. ISSN: 0082335X: Print Version.
A free, digital version of this publication can be found on: Texas ScholarWorks
RI0125. Atoka Group (Lower-Middle Pennsylvanian), Northern Fort Worth Basin Texas: Terrigenous Depositional Systems, Diagenesis, and Reservoir Distribution and Quality, by D. M. Thompson. 62 p., 27 figs., 5 tables, 19 plates, 1982. Print. ISSN: 0082335X: Print.
To purchase this publication as a downloadable PDF, please order RI0125D.
ABSTRACT
The Fort Worth Basin, in North-Central Texas, is a late Paleozoic foreland basin that was downwarped during the Early to Middle Pennsylvanian Period in response to tectonic stresses that also produced the Ouachita Thrust Belt. The Atoka Group was deposited during the initial westward progradation of chert-rich terrigenous clastics derived both from the Ouachita Thrust Belt and locally from the Muenster Arch across the northern part of the basin. At the northern end of the basin, the Atoka Group interfingers with arkosic conglomerates (granite wash) derived from the Red River-Electra Arch. The granite wash is time equivalent but constitutes a separate stratigraphic sequence. The Atoka Group contains three distinct packages of terrigenous deposits: (1) the lower Atoka lithogenetic unit, interpreted to be a fluvially dominated fan-delta system, (2) the upper Atoka "Davis" lithogenetic subunit, interpreted to be a system of coalesced wave-dominated deltas, and (3) the upper Atoka "post-Davis" lithogenetic subunit, interpreted to be a thin, poorly integrated, fluvially dominated fan-delta system.
Atoka Group sandstones are quartz-rich feldspathic (chert) litharenites. The most significant diagenetic events were silica dissolution and cementation. Net porosities of 10 to 15 percent are the result of the preservation of original porosity in between quartz overgrowths and the creation of secondary porosity by chert grain dissolution. Highest porosities occur in channel-fill and coarse-grained fan-delta plain facies.
The Atoka Group has a cumulative production history of more than 160 million barrels (oil plus gas equivalent). Production and reservoir distribution and quality are facies controlled. Most oil and gas fields coincide with the distribution of lower Atoka fan-delta lobe complexes. Minor production is located along the axes of upper Atoka "post-Davis" fan-delta complexes.
CONTENTS
ABSTRACT
INTRODUCTION
Setting
Objectives
Methods
TECTONIC SETTING
Regional structural elements
Ouachita Thrust Belt
Red River- Electra and Muenster Arches
Bend Flexure
Local structure
STRATIGRAPHY
Previous work and nomenclature
Operational nomenclature and lithogenetic units
DEPOSITIONAL SYSTEMS
Lower Atoka lithogenetic unit
Sandstone distribution
Limestone distribution
Facies
Interpretive model
Upper Atoka "Davis" lithogenetic subunit
Sandstone distribution
Limestone distribution
Facies
Interpretive model
Upper Atoka "post-Davis" lithogenetic subunit
Sandstone distribution
Limestone distribution
Facies
Interpretive model
PETROLOGY
Composition
Diagenesis
Porosity and permeability
HYDROCARBON PRODUCTION
Historical development
Production characteristics
Volume and distribution
RESERVOIR DISTRIBUTION AND QUALITY
Lower Atoka lithogenetic unit
Upper Atoka “Davis" lithogenetic subunit
Upper Atoka "post- Davis" lithogenetic subunit
CONCLUSIONS
ACKNOWLEDGMENTS
REFERENCES
APPENDICES
(1) Well logs used in cross sections
(2) Fields with a cumulative hydrocarbon production of 100,000 barrels or more (oil plus gas equivalent)
Figures
1. Location of Fort Worth Basin, North-Central Texas
2. Map of study area, showing well control, cross sections, and core locations
3. Ouachita Thrust Belt and associated structural elements
4. Generalized stratigraphy of the Fort Worth Basin, including a classification of the subsurface Atoka Group
5. Type log for the Atoka Group, Fort Worth Basin
6. Core illustrating lithology and sedimentary structures characteristic of fluvially dominated fan-delta facies, Atoka Group, North-Central Texas
7. Lower Atoka facies tract
8. Descriptive log of lower Atoka core, Gulf Oil Company, #2 Button Crowley, Jack County
9. Descriptive log of lower Atoka core, Mitchell Energy Company, #6-4 Deaver, Wise County
10. Distribution of lower Atoka facies
11. Upper Atoka "Davis" facies tract
12. Distribution of upper Atoka "Davis" facies
13. Descriptive log of upper Atoka "post-Davis" core (Shell Oil Company, #1 J. H. Doss, Parker County)
14. Distribution of upper Atoka "post-Davis facies
15. Composition of sandstones interpreted to have been derived from the Ouachita Thrust Belt
16. Composition of sandstones interpreted to have been derived from the Muenster Arch
17. Composition of sandstones interpreted to have been derived from the Ouachita Thrust Belt and the Muenster Arch
18. Diagenetic sequence for Atoka conglomerates and coarse-grained sandstones from terrigenous facies
19. Diagenetic sequence for Atoka fine-grained sandstones and siltstones from terrigenous facies
20. Diagenetic sequence for Atoka sandstones from mixed terrigenous carbonate facies or terrigenous facies that were in proximity to carbonates
21. Photomicrographs of thin sections from Gulf Oil Company #2 Button Crowley core, lower Atoka lithogenetic unit, Jack County, Texas
22. Distribution of lower Atoka hydrocarbon fields
23. Distribution of upper Atoka "Davis" hydrocarbon fields
24. Distribution of upper Atoka "post-Davis" hydrocarbon fields
25. Facies framework of lower Atoka hydrocarbon reservoirs
26. Facies framework of upper Atoka "Davis" hydrocarbon reservoirs
27. Facies framework of upper Atoka "post-Davis" hydrocarbon reservoirs
Tables
1. Classification schemes applied to Lower to Middle Pennsylvanian rocks of Central and North-Central Texas
2. Summary of studies on the Atoka Group and other Lower to Middle Pennsylvanian strata
3. Summary of lower Atoka facies, characteristics, and depositional processes
4. Summary of inferred upper Atoka "Davis" facies
5. Compositional components of sandstones of the Atoka Group
Plates
I. Map of data base, northern Fort Worth Basin, Texas
II. Dip cross section A-A'
III. Dip cross section B-B'
IV. Dip cross section C-C'
V. Dip cross section D-D’
VI. Dip cross section E-E'
VII. Dip cross section F-F'
VIII. Strike cross section 1 -1'
IX. Strike cross section 2-2'
X. Strike cross section 3-3'
XI. Structure map, top of pre-Atoka strata
XII. Isopach map, lower Atoka lithogenetic unit
XIII. Isopach map, upper Atoka lithogenetic unit
XIV. Net-sandstone map, lower Atoka lithogenetic unit
XV. Net-limestone map, lower Atoka lithogenetic unit
XVI. Net-sandstone map, upper Atoka "Davis" lithogenetic subunit
XVII. Net-sandstone map, upper Atoka "post-Davis" lithogenetic subunit
XVIII. Net-limestone map, upper Atoka lithogenetic unit
XIX. Map of volume and distribution of cumulative hydrocarbon production, Atoka Group
Citation
Thompson, D. M., 1982, Atoka Group (Lower-Middle Pennsylvanian), Northern Fort Worth Basin Texas: Terrigenous Depositional Systems, Diagenesis, and Reservoir Distribution and Quality: The University of Texas at Austin, Bureau of Economic Geology, Report of Investigations No. 125, 62 p.


