Reports of Investigations
-
Books & Reports
- Reports of Investigations
- Guidebooks
- Udden Series
- Geological Circulars
- Down To Earth
- Atlases of Major Oil and Gas Reservoirs
- Texas Memorial Museum Publications
- Environmental Geologic Atlas of the Texas Coastal Zone
- Mineral Resource Circulars
- Other Reports
- Seminars and Workshops
- Handbooks
- Submerged Lands of Texas
- Symposia
- Annual Reports
- Open File Reports
-
Maps & Cross Sections
- Thematic Maps
- Miscellaneous Maps, Charts & Sections
- Geologic Atlas of Texas
- STATEMAP Project Maps
- Geologic Quadrangle Maps
- Cross Sections
- Highway Geology Map
- Energy and Mineral Resource Maps
- Shoreline Change and Other Posters
- Wilcox Group, East Texas, Geological / Hydrological Folios
- Bouguer Gravity Atlas of Texas
- River Basin Regional Studies
- Featured Maps
- Posters
- Teachers & the Public
-
Geological Society Publications
- Gulf Coast Association of Geological Societies
- Alabama Geological Society
- Austin Geological Society
- Corpus Christi Geological Society
- Houston Geological Society
- Lafayette Geological Society
- Mississippi Geological Society
- New Orleans Geological Society
- South Texas Geological Society
- GCS SEPM Publications
- Historic BEG & UT Series

Stochastic Analysis of Aquifer Interconnectedness: Wilcox Group,... East Texas. Digital Download
RI0189D
For a print version: RI0189.
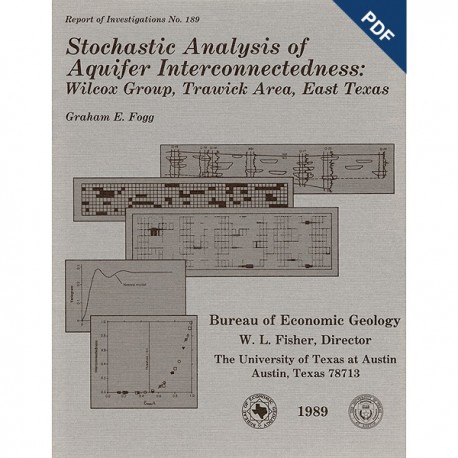
RI0189D. Stochastic Analysis of Aquifer Interconnectedness: Wilcox Group, Trawick Area, East Texas, by G. E. Fogg. 68 p., 41 figs., 4 tables, 5 appendices, 1989. doi.org/10.23867D/RI0189D. Downloadable PDF.
To purchase this publication in book format, please order RI0189.
ABSTRACT
Detailed characterization of the spatial distribution of hydraulic conductivity (K) by direct measurement is usually impractical. A viable alternative is to use geologic information and geostatistics to characterize interconnectedness of critical K facies that have a dominant influence on fluid flow. Conditional simulation is introduced herein as a method for estimating aquifer interconnectedness. Facies continuity is accounted for by the variogram, which can be determined by conventional means or synthesized from information on average dimensions and fractional content of the K facies of interest.
A test case in a 6 by 11 mi (10 by 18 km) region in the East Texas Wilcox Group, a fluvial multiple aquifer system, demonstrates the feasibility of this approach. Two-dimensional conditional and unconditional simulations of channel-sand distribution along a strike cross section indicate sensitivity of interconnection probability (P) and equivalent K to sand-bod) continuity, variogram range and model, flow-region length, and sand fraction (SF). Conditional simulations are generated efficiently with an improved matrix technique that takes advantage of the vertical continuity of geophysical log data.
Results show that if the variogram and SF can be estimated, continuity and interconnectedness of facies in stationary systems can be characterized with acceptable accuracy. However, P and equivalent K are much more sensitive to SF than to the variogram range or model. Removal of data from the simulations causes loss of local detail on interconnection frequency but does not noticeably change the overall average continuity of sands or equivalent K. P exhibits threshold behavior, increasing abruptly when SF exceeds 0.3 to 0.5. The relationship between SF and equivalent K differs from that predicted by percolation theory owing to the presence of spatial correlation and nonzero K values assigned to the interchannel facies.
Keywords: aquifer, geostatistics, ground water, ground-water modeling, heterogeneity, interconnectedness, reservoir characterization, stochastic, Wilcox Group
CONTENTS
Nomenclature
Abstract
Introduction
Conceptual Framework
Use of Geologic Data in Ground-Water Models
The Problem
A Stochastic Approach: Conditional Simulation
Geostatistical Theory
The Variogram
Stationarity, Intrinsic Hypothesis, and Ergodicity
Kriging
The variance and covariance of e
Conditional Simulation
Unconditional Simulation
Test Case: Wilcox Group, Trawick Area, East Texas
Hydrogeologic Setting
Depositional Framework
Recognition of Channel-Fill Sands
Methods: Estimating Aquifer Interconnectedness
Geologic Characterization
Choice and Regularization of Simulation Variable
Statistical Analysis
Simulation of Sand Thickness
Back-transforming the simulated variable (Y)
Scanning the simulation results
Flow Simulation
Experimental Strategy
Performance of Simulation Algorithms
Estimating Interconnectedness and Its Influence on Flow
Comparison with geologic description
Effects of data conditioning and variogram model
Interconnectedness and equivalent hydraulic conductivity (K')
Results and Interpretation
Preliminary Statistical Analysis
Transforming S, to a normal distribution
Experimental variograms
Fitting variogram models
Comparison of Sand Distributions Obtained by Simulation and Geologic Interpretation
Geologic interpretation of sand distribution
Comparison with simulated sands
Effects of Data Conditioning
Influence of Variogram Model
Comparison of spherical and Bessel-exponential models
Effects of variogram sill and range
Synthesizing the Variogram from Geologic Information
Estimating the variogram
Interconnection Probability
Equivalent Hydraulic Conductivity
K' as a function of sand-body continuity
K' as a function of sand fraction
Prediction uncertainty of K'
Discussion
Limitations of Method
Discretization errors and an alternate approach
Two versus three dimensions in the fluvial system
Stationarity and ergodicity
Delineating permeability facies and defining a cutoff
Incorporating Geologic Information in Models
Synthesizing the variogram in fluvial systems
Applying Monte Carlo simulation results to ground-water modeling
Perspective on Oakwood modeling study
Comparison with Percolation Theory
Analytic Methods of Estimating K'
Summary and Conclusions
Acknowledgments
References
Appendices
A. Derivation of Covariance Vnm
B. Theory of Matrix Conditional Simulation
C. Conditional Simulation along Panels
D. Performance of Algorithms
E. Conditional Probability Theory of Facies Continuity
Text Figures
I. Log-normal hydraulic conductivity (K) distribution on arithmetic and log scales
2. Effect of a high-K channel on ground-water flow
3. Location of Trawick area and well control used in this study
4. Sketch illustrating the sand-body correlation problem between wells
5. Concept of conditional simulation illustrated in one dimension
6. Sketch illustrating computation of the experimental variogram
7. Schematic diagram of kriging
8. Maximum-sand map, Wilcox Group, Sabine Uplift area
9. Histograms showing K values of channel-fill and interchannel sediments of the Wilcox Group, Oakwood Dome area
10. Representative electric log, Wilcox Group, Trawick area
11. Cross section A-A'
12. Sand-isolith map, SU3 unit, Trawick area
13. Sand-isolith map, SU2 unit, Trawick area
14. Charts showing how sand thicknesses were regularized to 50-ft (15-m) intervals
15. Schematic diagram illustrating delineation of three-dimensional search zones for variogram analysis of Srdata
16. Schematic diagram illustrating interconnected sand domains in the conditional simulation grid
17. Schematic diagram illustrating setup for flow simulations in which equivalent hydraulic conductivity (K') was computed
18. Histograms and normal probability plots of regularized sand thickness Sr for SU3
19. Histogram and normal probability plot of regularized sand thickness Sr for SU228
20. Directional experimental variograms, SU3 unit
21. Sketch illustrating potential causes of poorer than expected correlation in the dip direction in SU3
22. Directional experimental variograms, SU2 unit
23. Spherical and nested Bessel-exponential models fit to the experimental variograms from·SU3
24. Geologic interpretation of sand-body occurrence and continuity in cross section A-A'
25. Comparison of simulated and interpreted sands
26. Interconnectedness frequency (ICF) plots for simulations IIIA, IIIB, IIIC, and IV
27. ICF plot, simulation I
28. ICF plot, simulation V
29. Plot of average horizontal continuity of sand and horizontal interconnection probability versus variogram range, simulations IV through X
30. Plot of K’h, versus variogram range, simulations IV through X
31. Sand fraction versus horizontal interconnection probability, runs IV, IV1-5; VII, VII 1,2,5; and VIII, Vl11 1,2,5
32. Sand fraction versus vertical interconnection probability, runs IV, IV1-5; VI, VI1,2,5; and VI II , VIII1 ,2,5
33. Equivalent length of flow region versus Ph, runs IV, VI-X; IV, , VII, , VIili; and IV2, V!i-X2
34. L/ C hmax•versus Ph, runs IV, VI-X; IV1, VII1, VIII; and IV2, Vh-X2
35. Average horizontal sand-body continuity versus horizontal equivalent K, runs IVA-XA; IVB-XB; IV 1B-X1B; and IV2B-X2B
36. Ch versus Kt,, runs IVC-XC
37. SF versus Kt,, runs IVA, IV1-sA: IVB, IV1-sB; VIIB, VII1,2,sB; VIIIB, VIII1,2,sB; and VIIC, VII1 ,2,sC . ..
38. SF versus K:., runs IVA, IV 1-sA
39. SF versus K ~, runs IVB, IV 1-sB
40. Ch versus coefficient of variation (Vh and Yv) of K', runs IVA-XA, IVB-XB, IV2B-X2B, and IVC-XC 41.
41. SF versus coefficient of variation (Vh and Vv) of K', runs IVA, IV1-5A;VIIB, VII1,2,5B; and VIIC, VII1-5C
Text Tables
1. Conditions imposed in each simulation
2. Calculated versus simulated horizontal interconnection probability
3. Interconnection probability and equivalent hydraulic conductivity
4. Fluvial-channel width/ depth ratios for selected simulations
Appendix Figures
C-1. Schematic diagram of conditional simulation along panels
D-1. Comparison of spherical variogram model and experimental variograms computed from results of conditional simulation I
D-2. Comparison of nested Bessel-exponential variogram model and mean experimental variogram from conditional simulation BIA
D-3. Interconnectedness frequency plots for conditional simulations IIA through IID
D-4. Plot of mean, average maximum, and ensemble maximum horizontal continuity versus horizontal block size
D-5. Plot of norm of Sr versus number of realizations in the conditional simulation
Appendix Table
D-1. Ensemble statistics from conditional and unconditional simulations
Citation
Fogg, G. E., 1989, Stochastic Analysis of Aquifer Interconnectedness: Wilcox Group, Trawick Area, East Texas: The University of Texas at Austin, Bureau of Economic Geology, Report of Investigations No. 189, 68 p.


